
Exploring ADBE OI & Volume
Discovering tickers by a combination of flowratio rankings and volume, buy/sell, open interest distributions.

FlowRatio Rankings
Why ADBE ? It has earnings coming up June 15 ( we saw what happened with NVDA earnings and AI hype). Adobe just released their “generative fill” feature, and it could be a stock with earnings surprise.
But that is not why I found it. As part of my usual market monitoring - I always rank tickers by a variety of metrics. Some of my routine metrics are 'call buy volume', 'call buy value', 'value buys vs sells' and 'flowratio', all of which I use to find tickers with an expected surge in call buying.
Usually the top tickers are always the same - /ES, SPX, SPY, AAPL, TSLA, AMZN, etc. - the usual suspects. However, every now and then a ticker makes its way up into the rankings holding a surprise.
Ranking for 'flowratio' tends to have the most interesting rankings. Full of false positives so it takes a bit of putting together the pieces of the puzzle to truly uncover the secret.
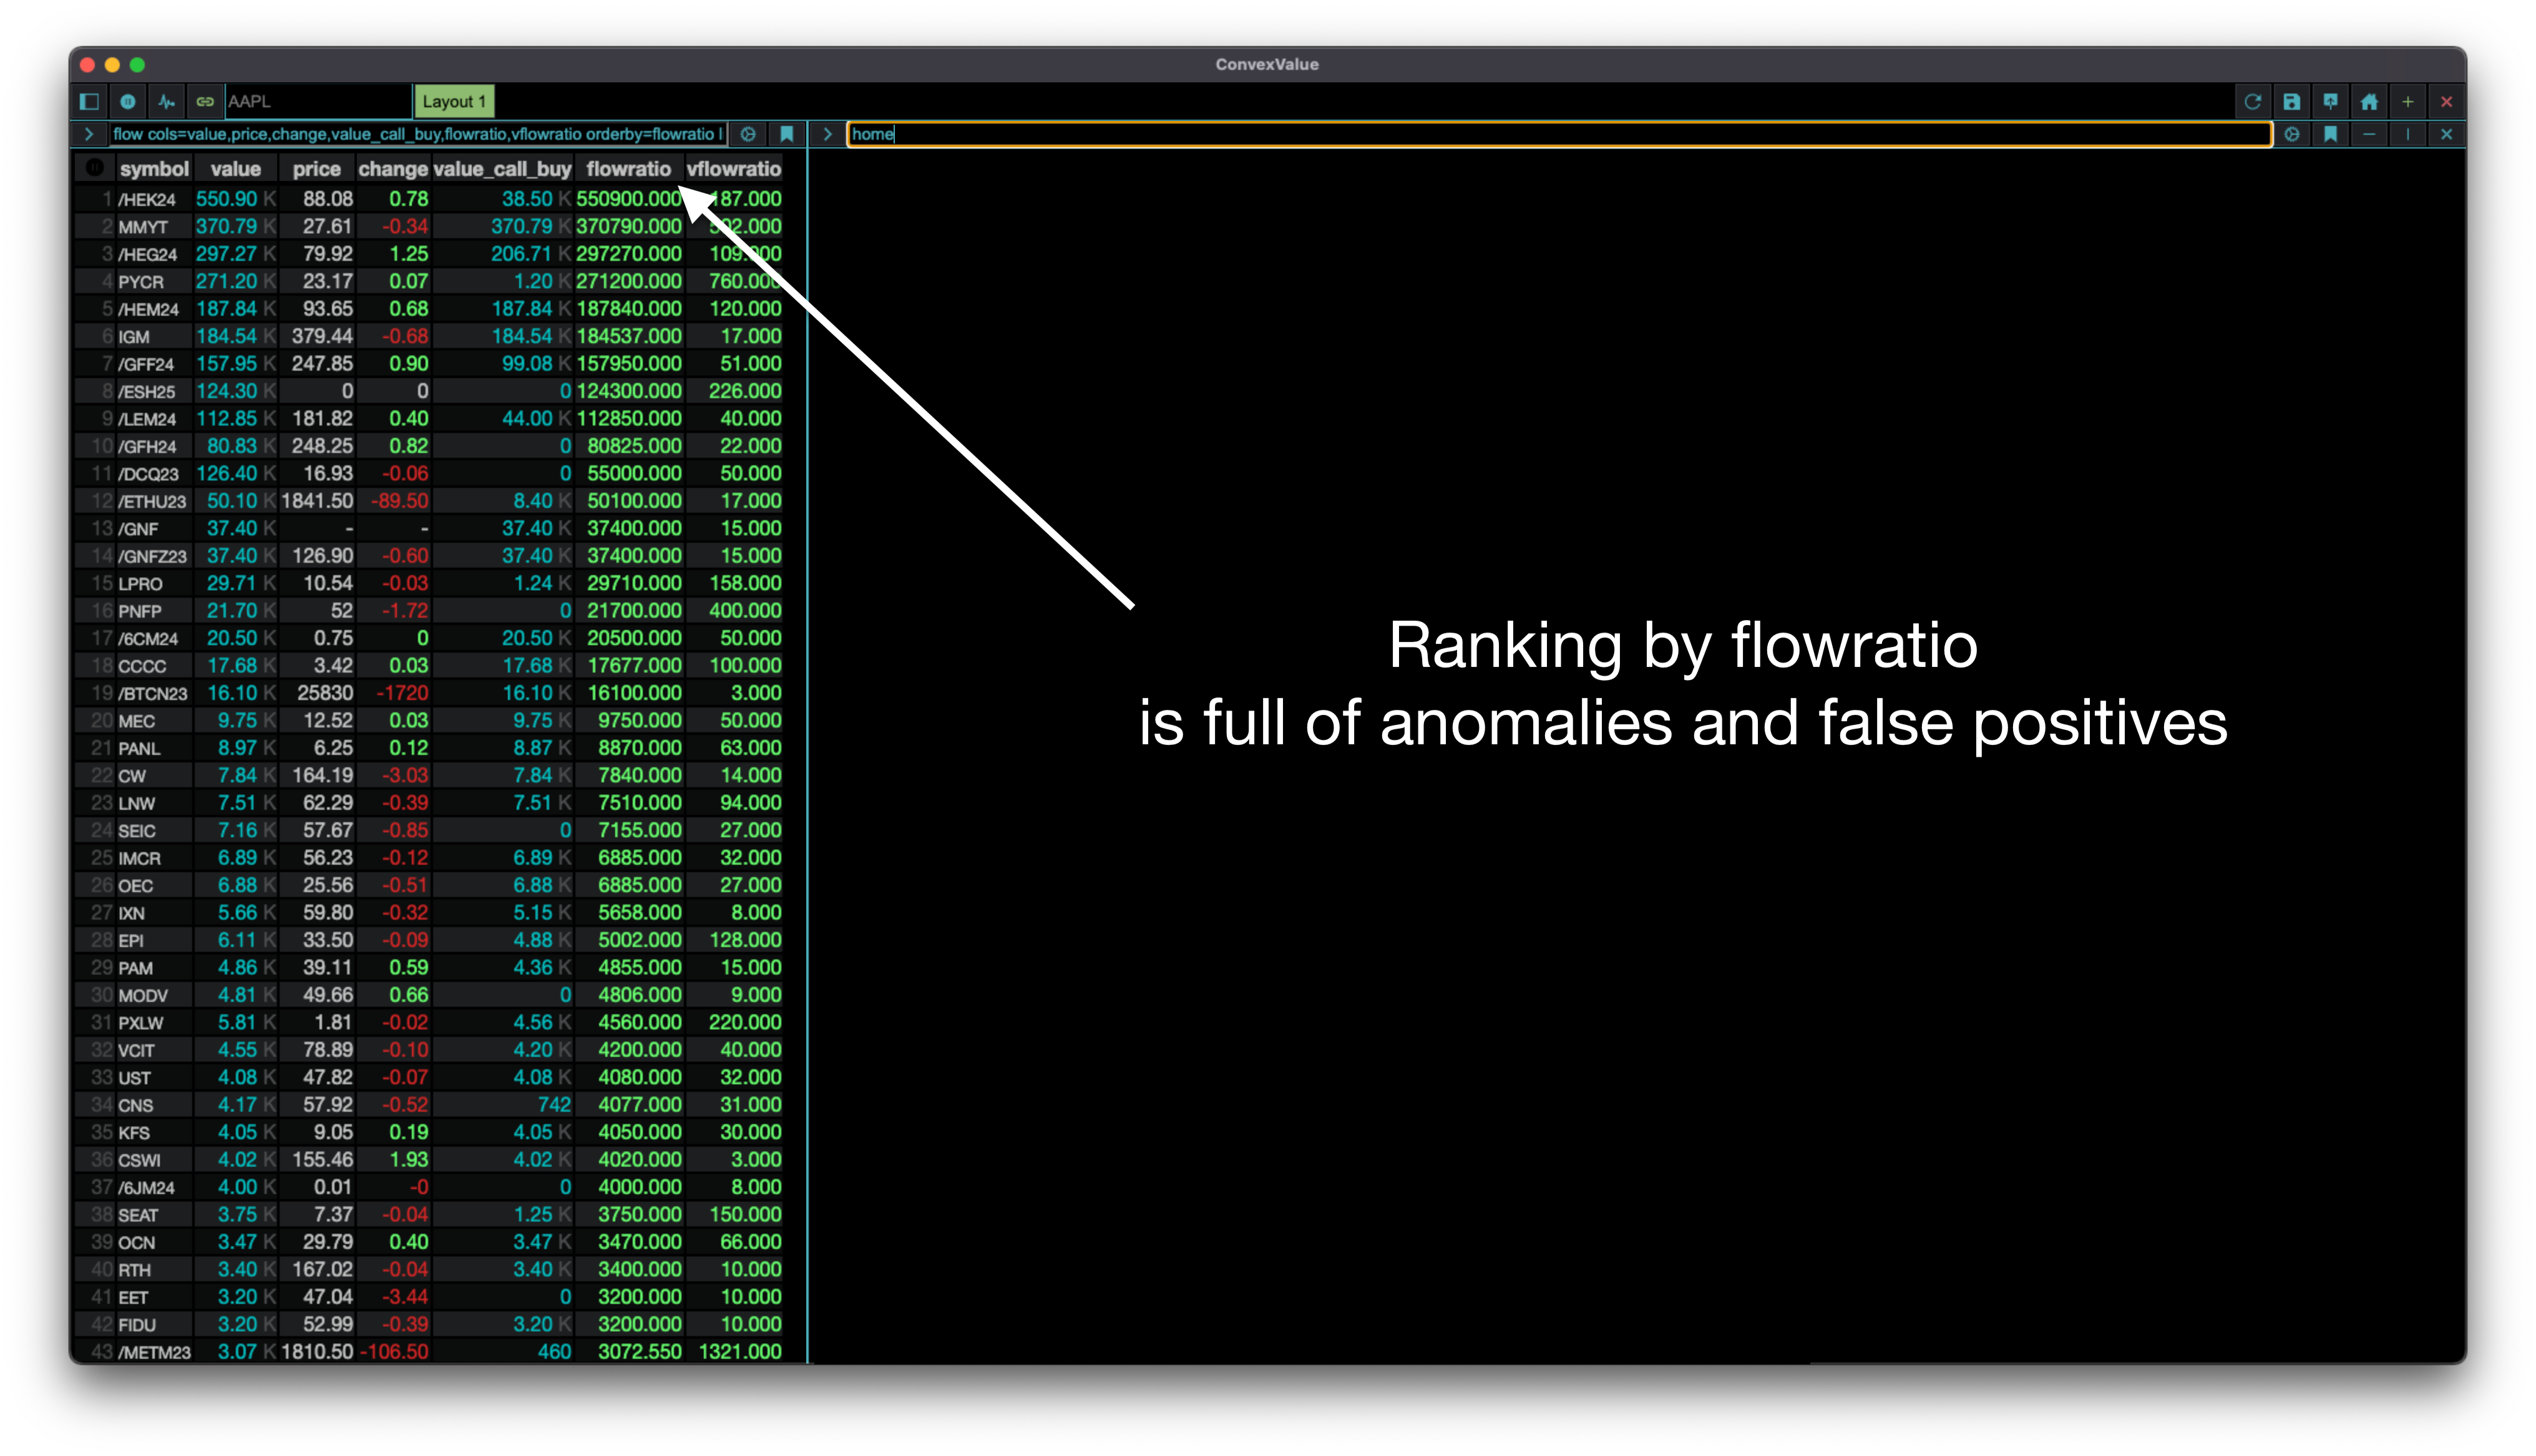
The above is ranked by flowratio which is a metric that loosely measures “bullishness” vs “bearishness” of options flow. The higher the flowratio, the more “bullish” the stock.
However - as you can see above - it is full of stocks with very low volume. Unknown names with sometimes as low as 1k in premium traded. For example - let’s look at value of buys and sells broken down into expirations for the second ticker, MMYT:
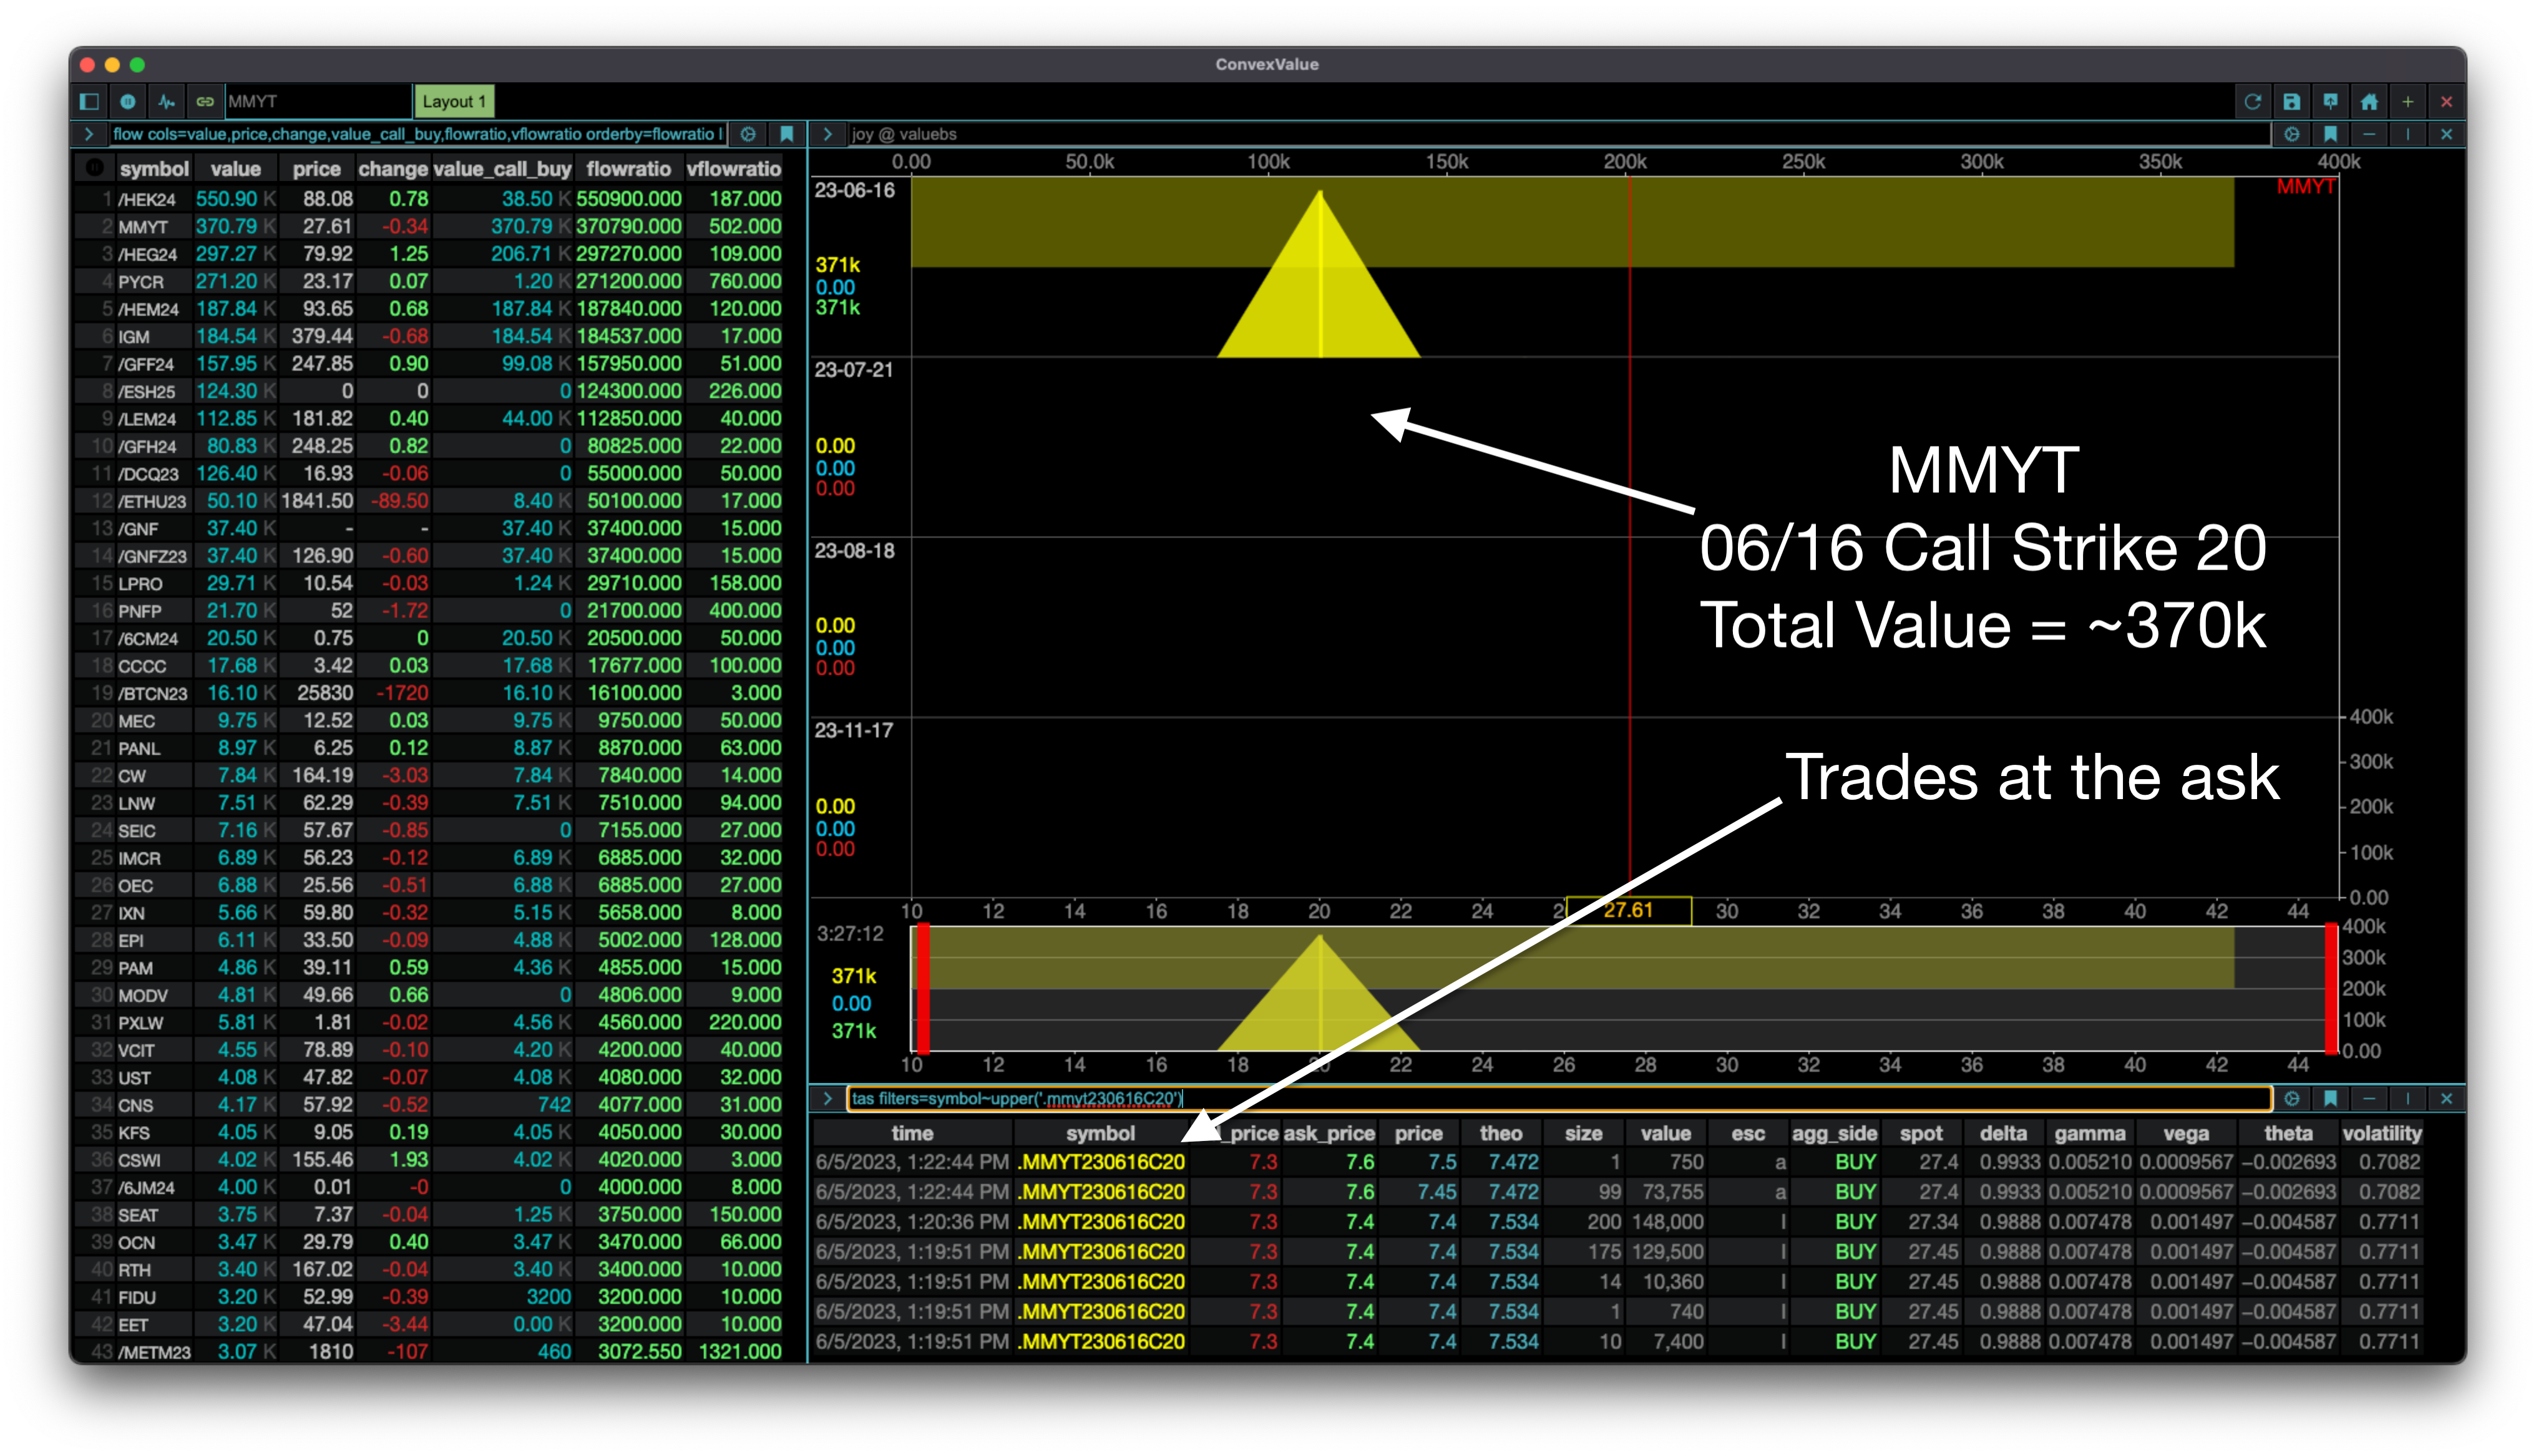
The entire $370k worth of premium traded for MMYT options is in buys of that June 16 Call strike 20. Nearly all of the 7 trades are at the ask. The call is in-the-money and the size is small.
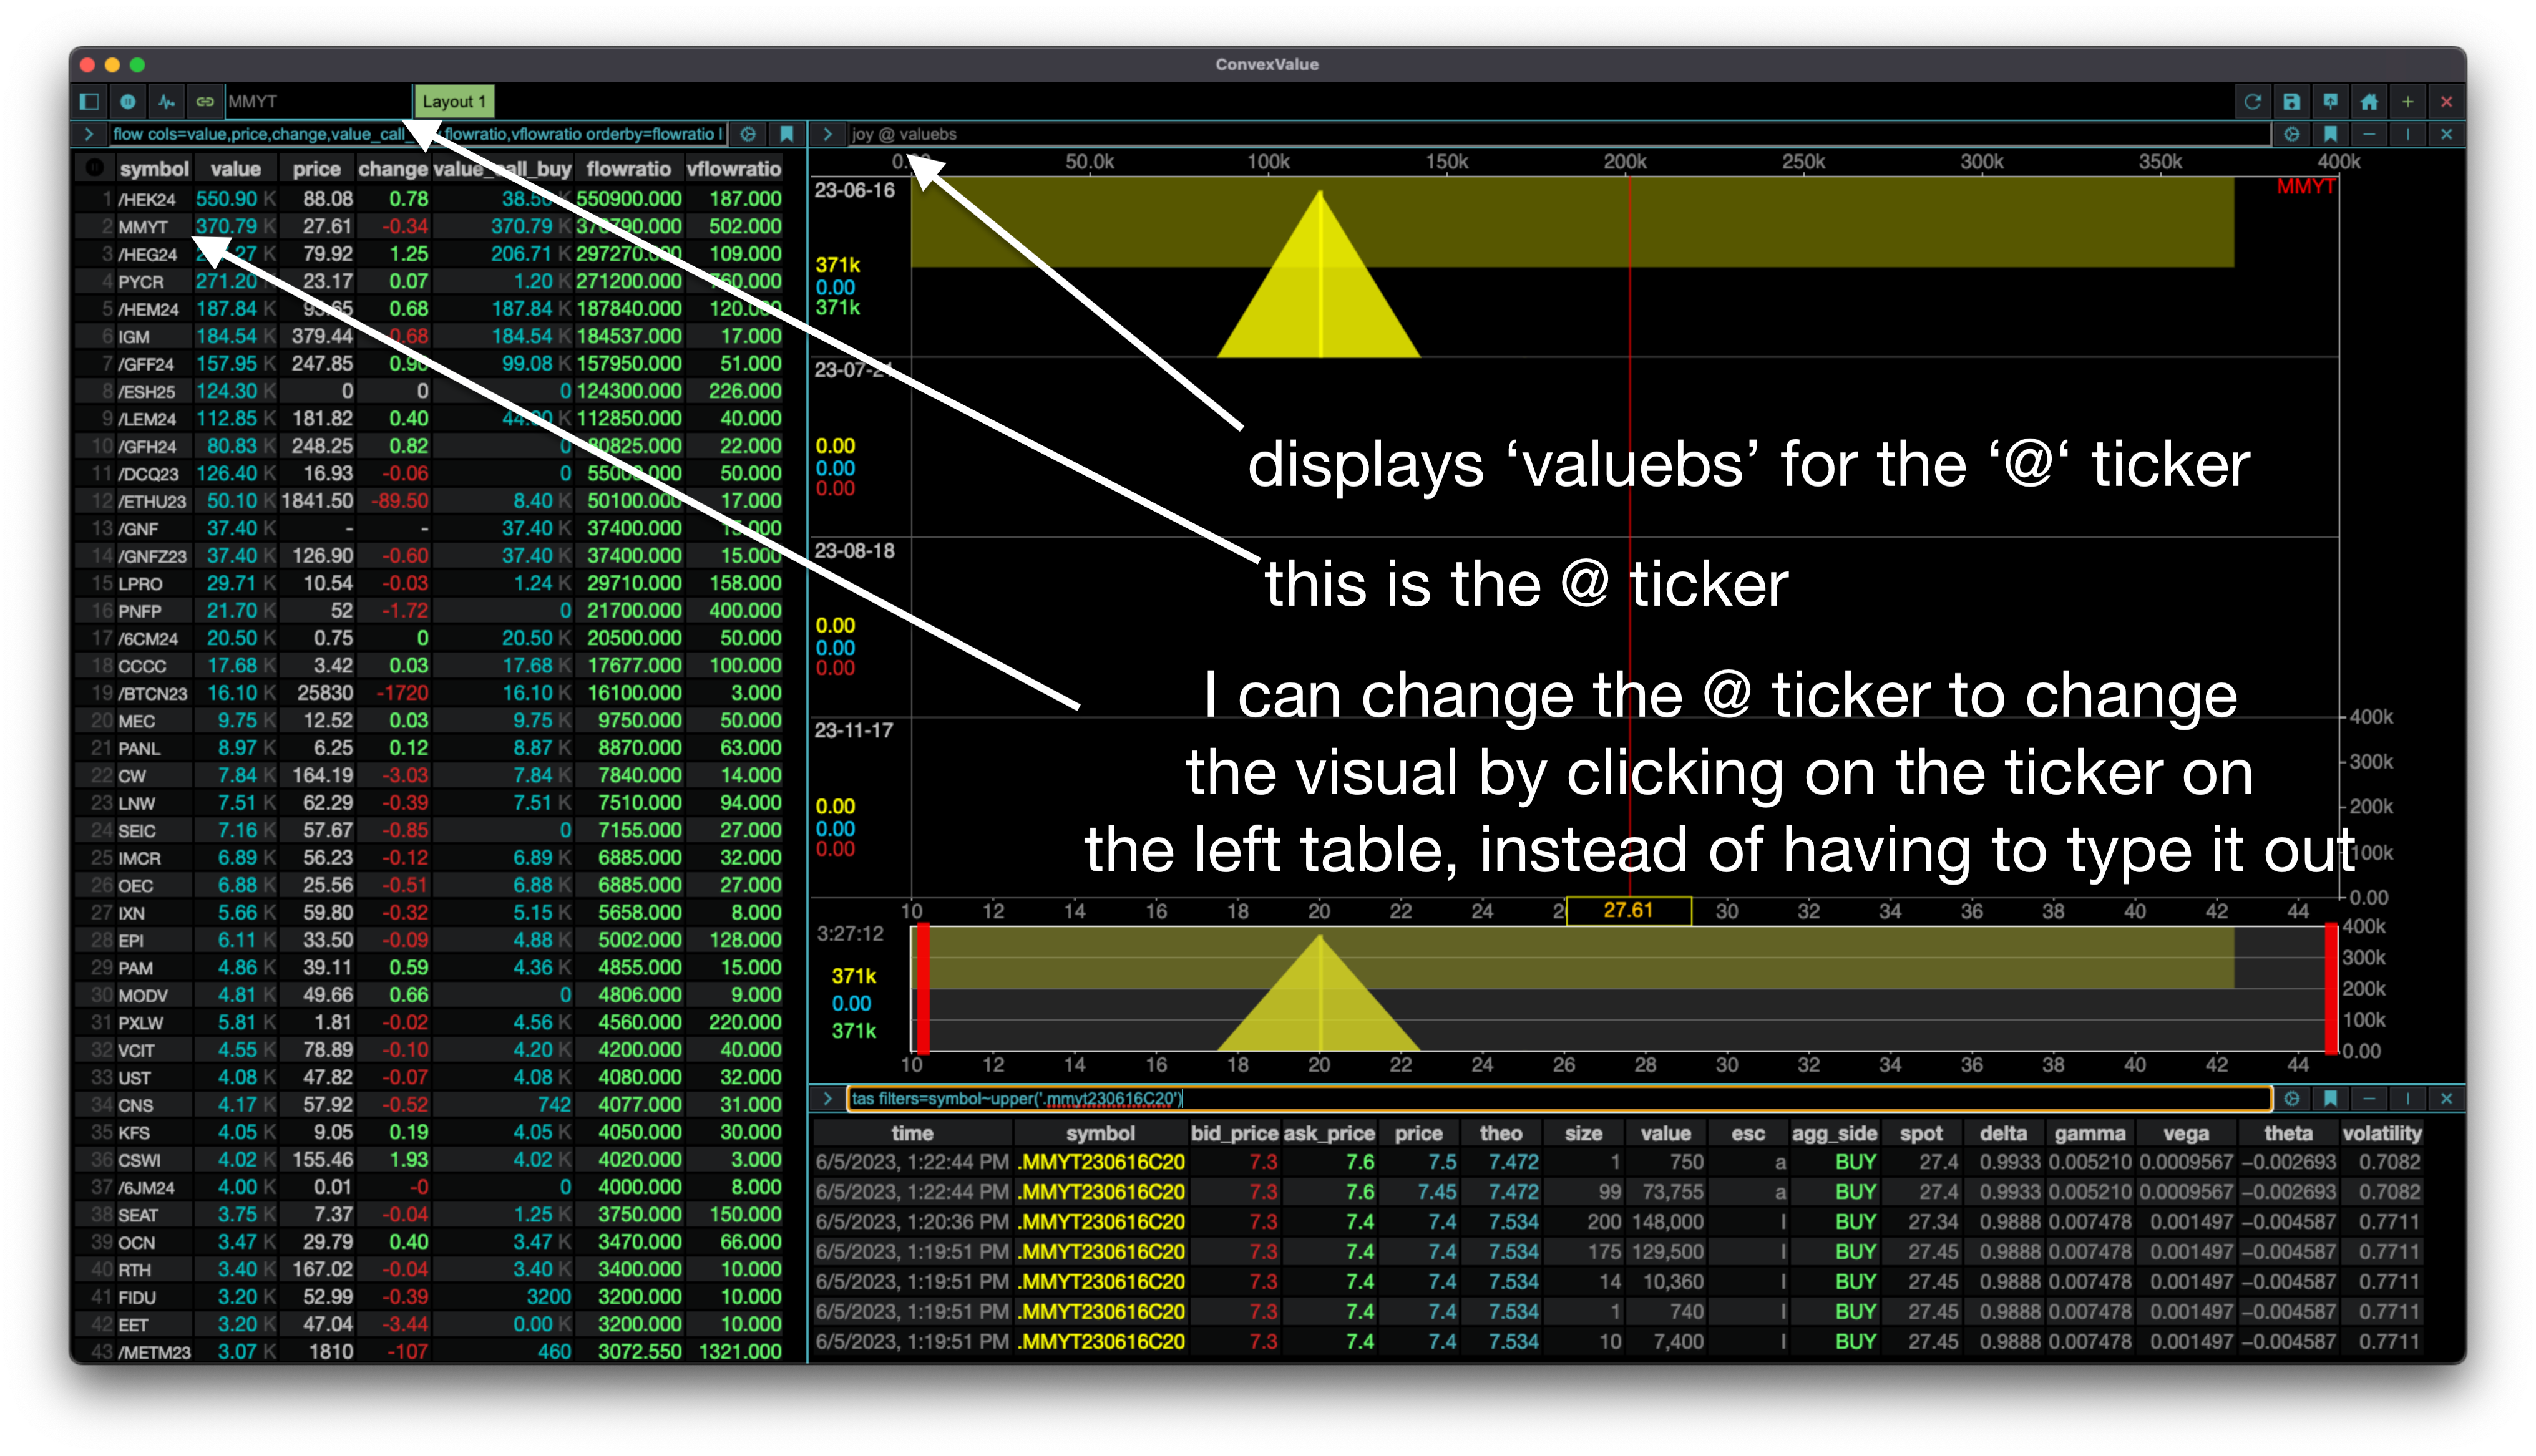
I’ll do this with most of the stocks in the list (using the @ command to be able to change tickers by clicking on the left table - which is also useful if you are looking at many different modules at once and what to change the ticker for all of them)
However, most of it is noise (although I always do it because I have found great biotech plays this way). My next step is filtering the table to only show tickers with over 1M, 10M, 100M, etc. in Value traded:
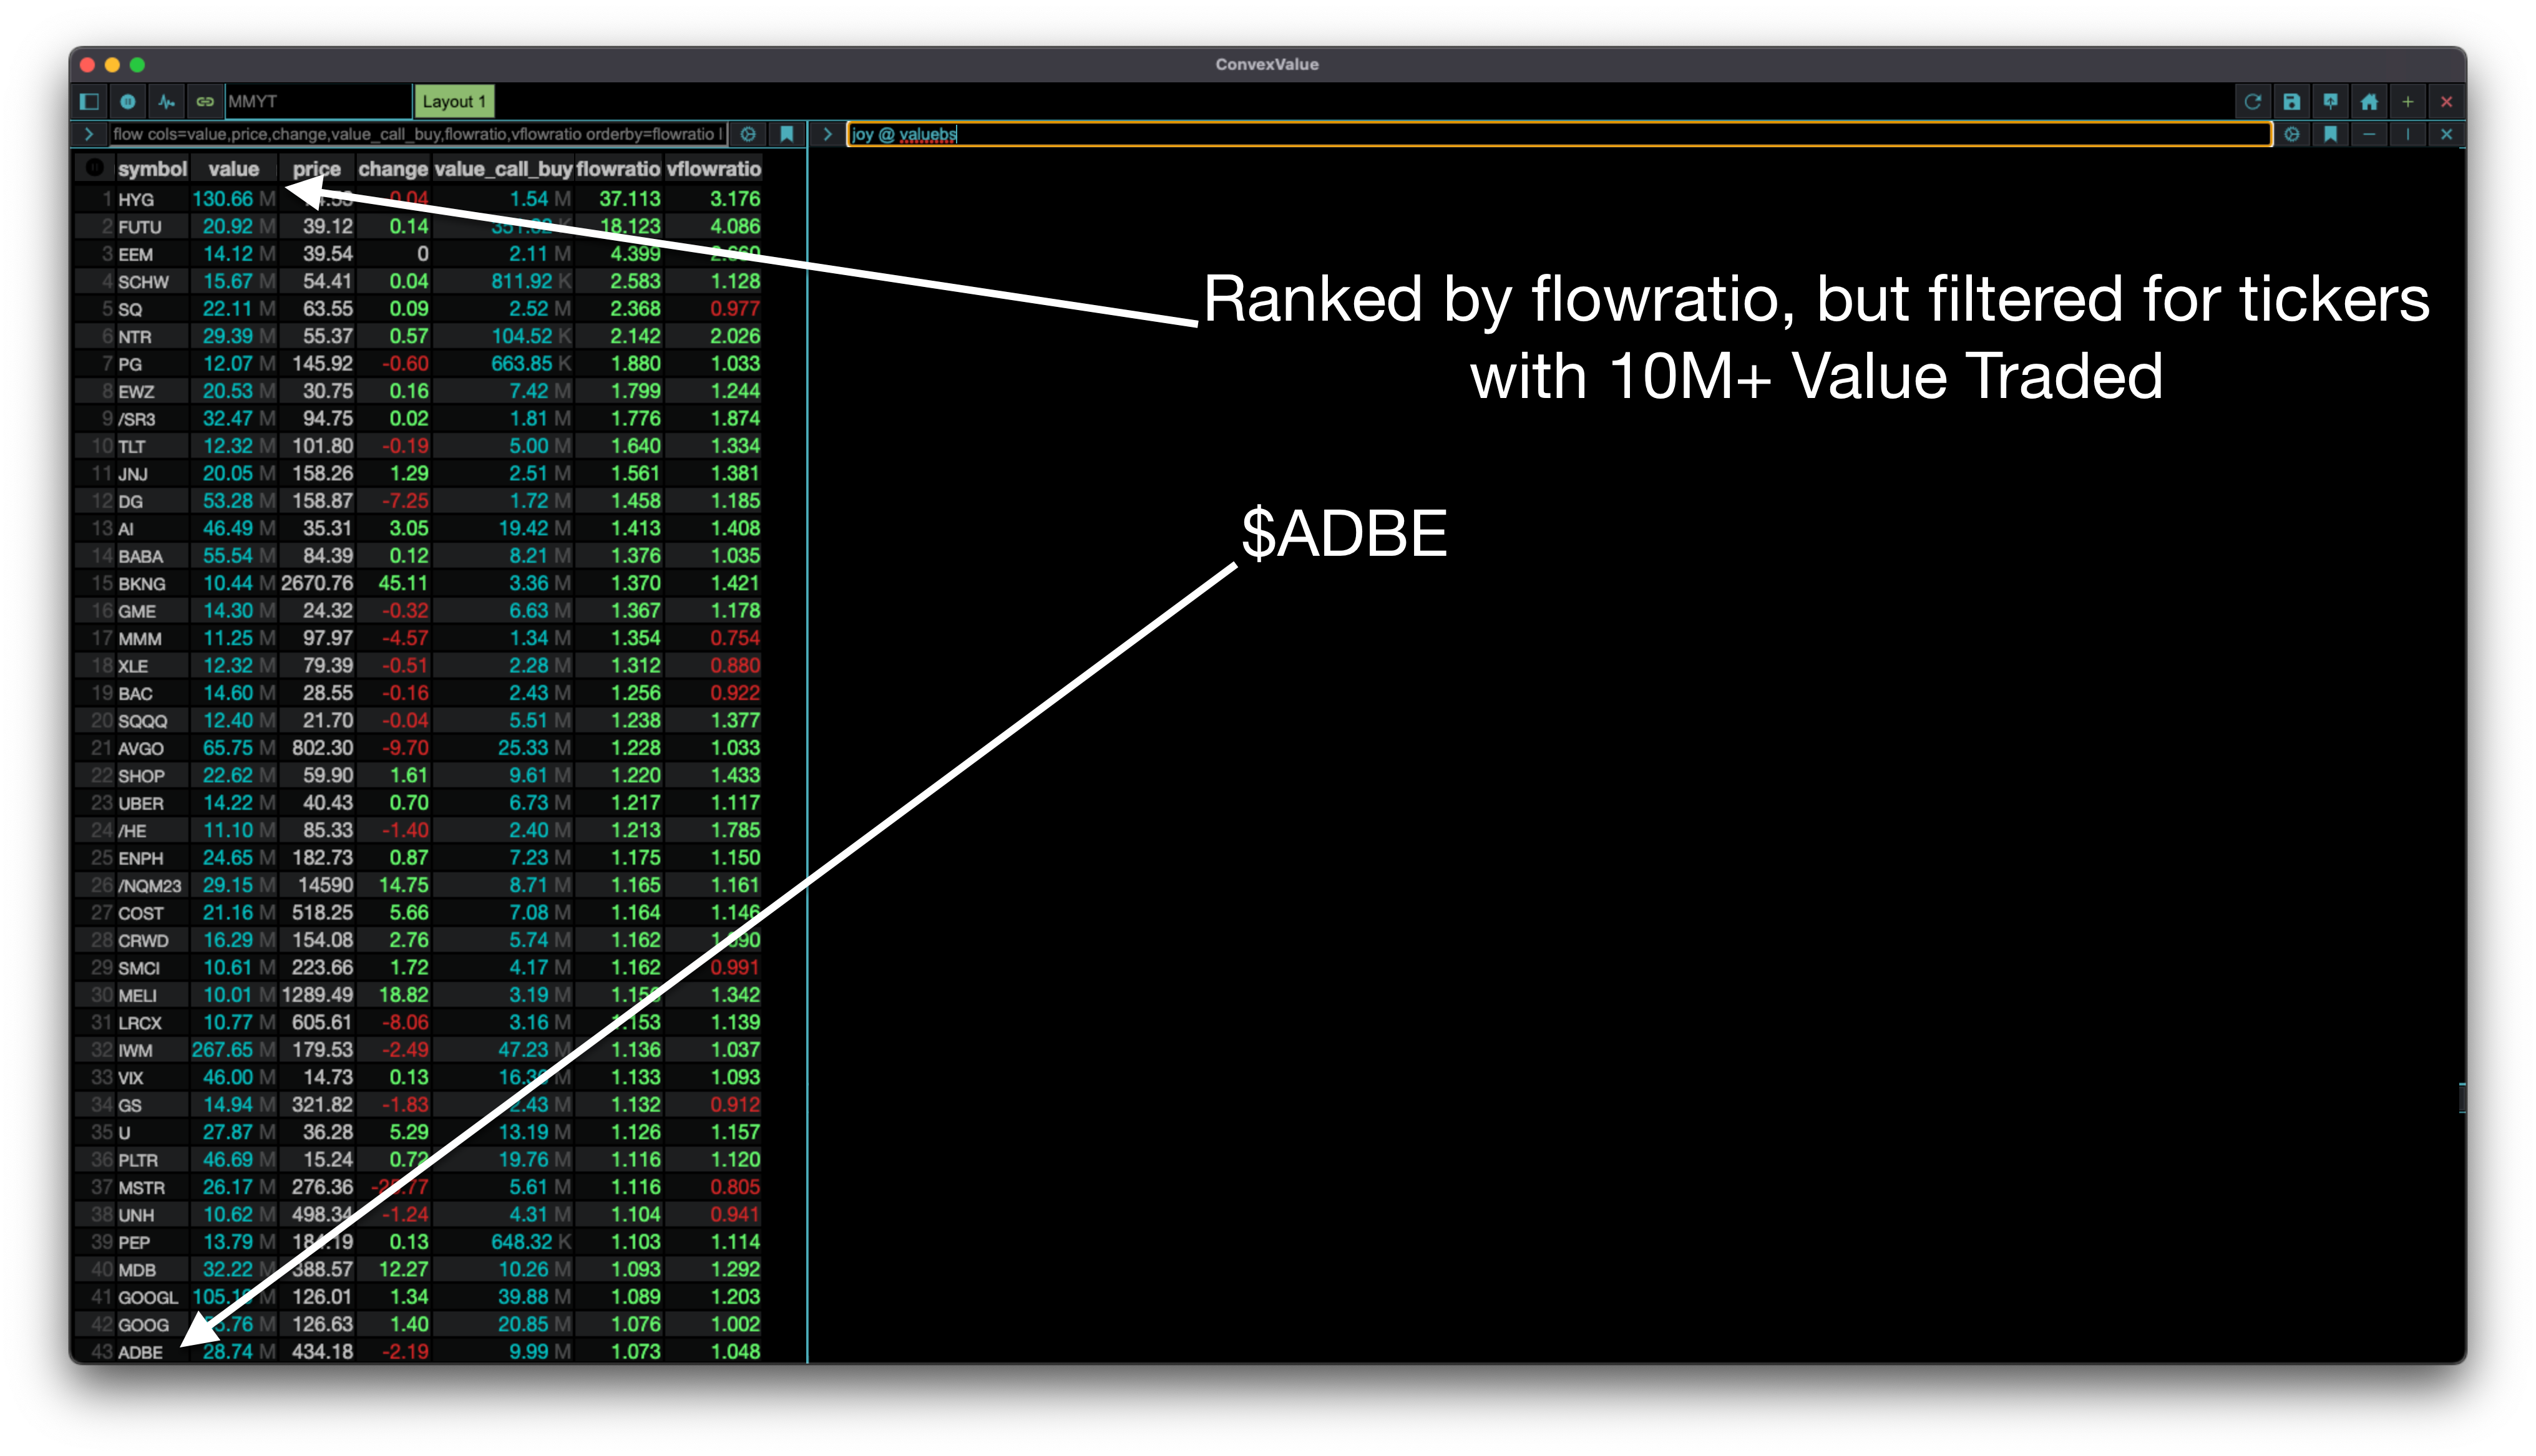
As you can see the tickers now are more familiar. Big names such as HYG (which is a topic for a different post), JNJ, AI, UBER, BABA, etc.
Volume, Buy/Sell, OI Distributions
However, this ranking alone isn’t the full picture. I want to see exactly in what strikes & expirations those calls and puts are being sold. So I’ll scroll through all the tickers with the following two layouts.
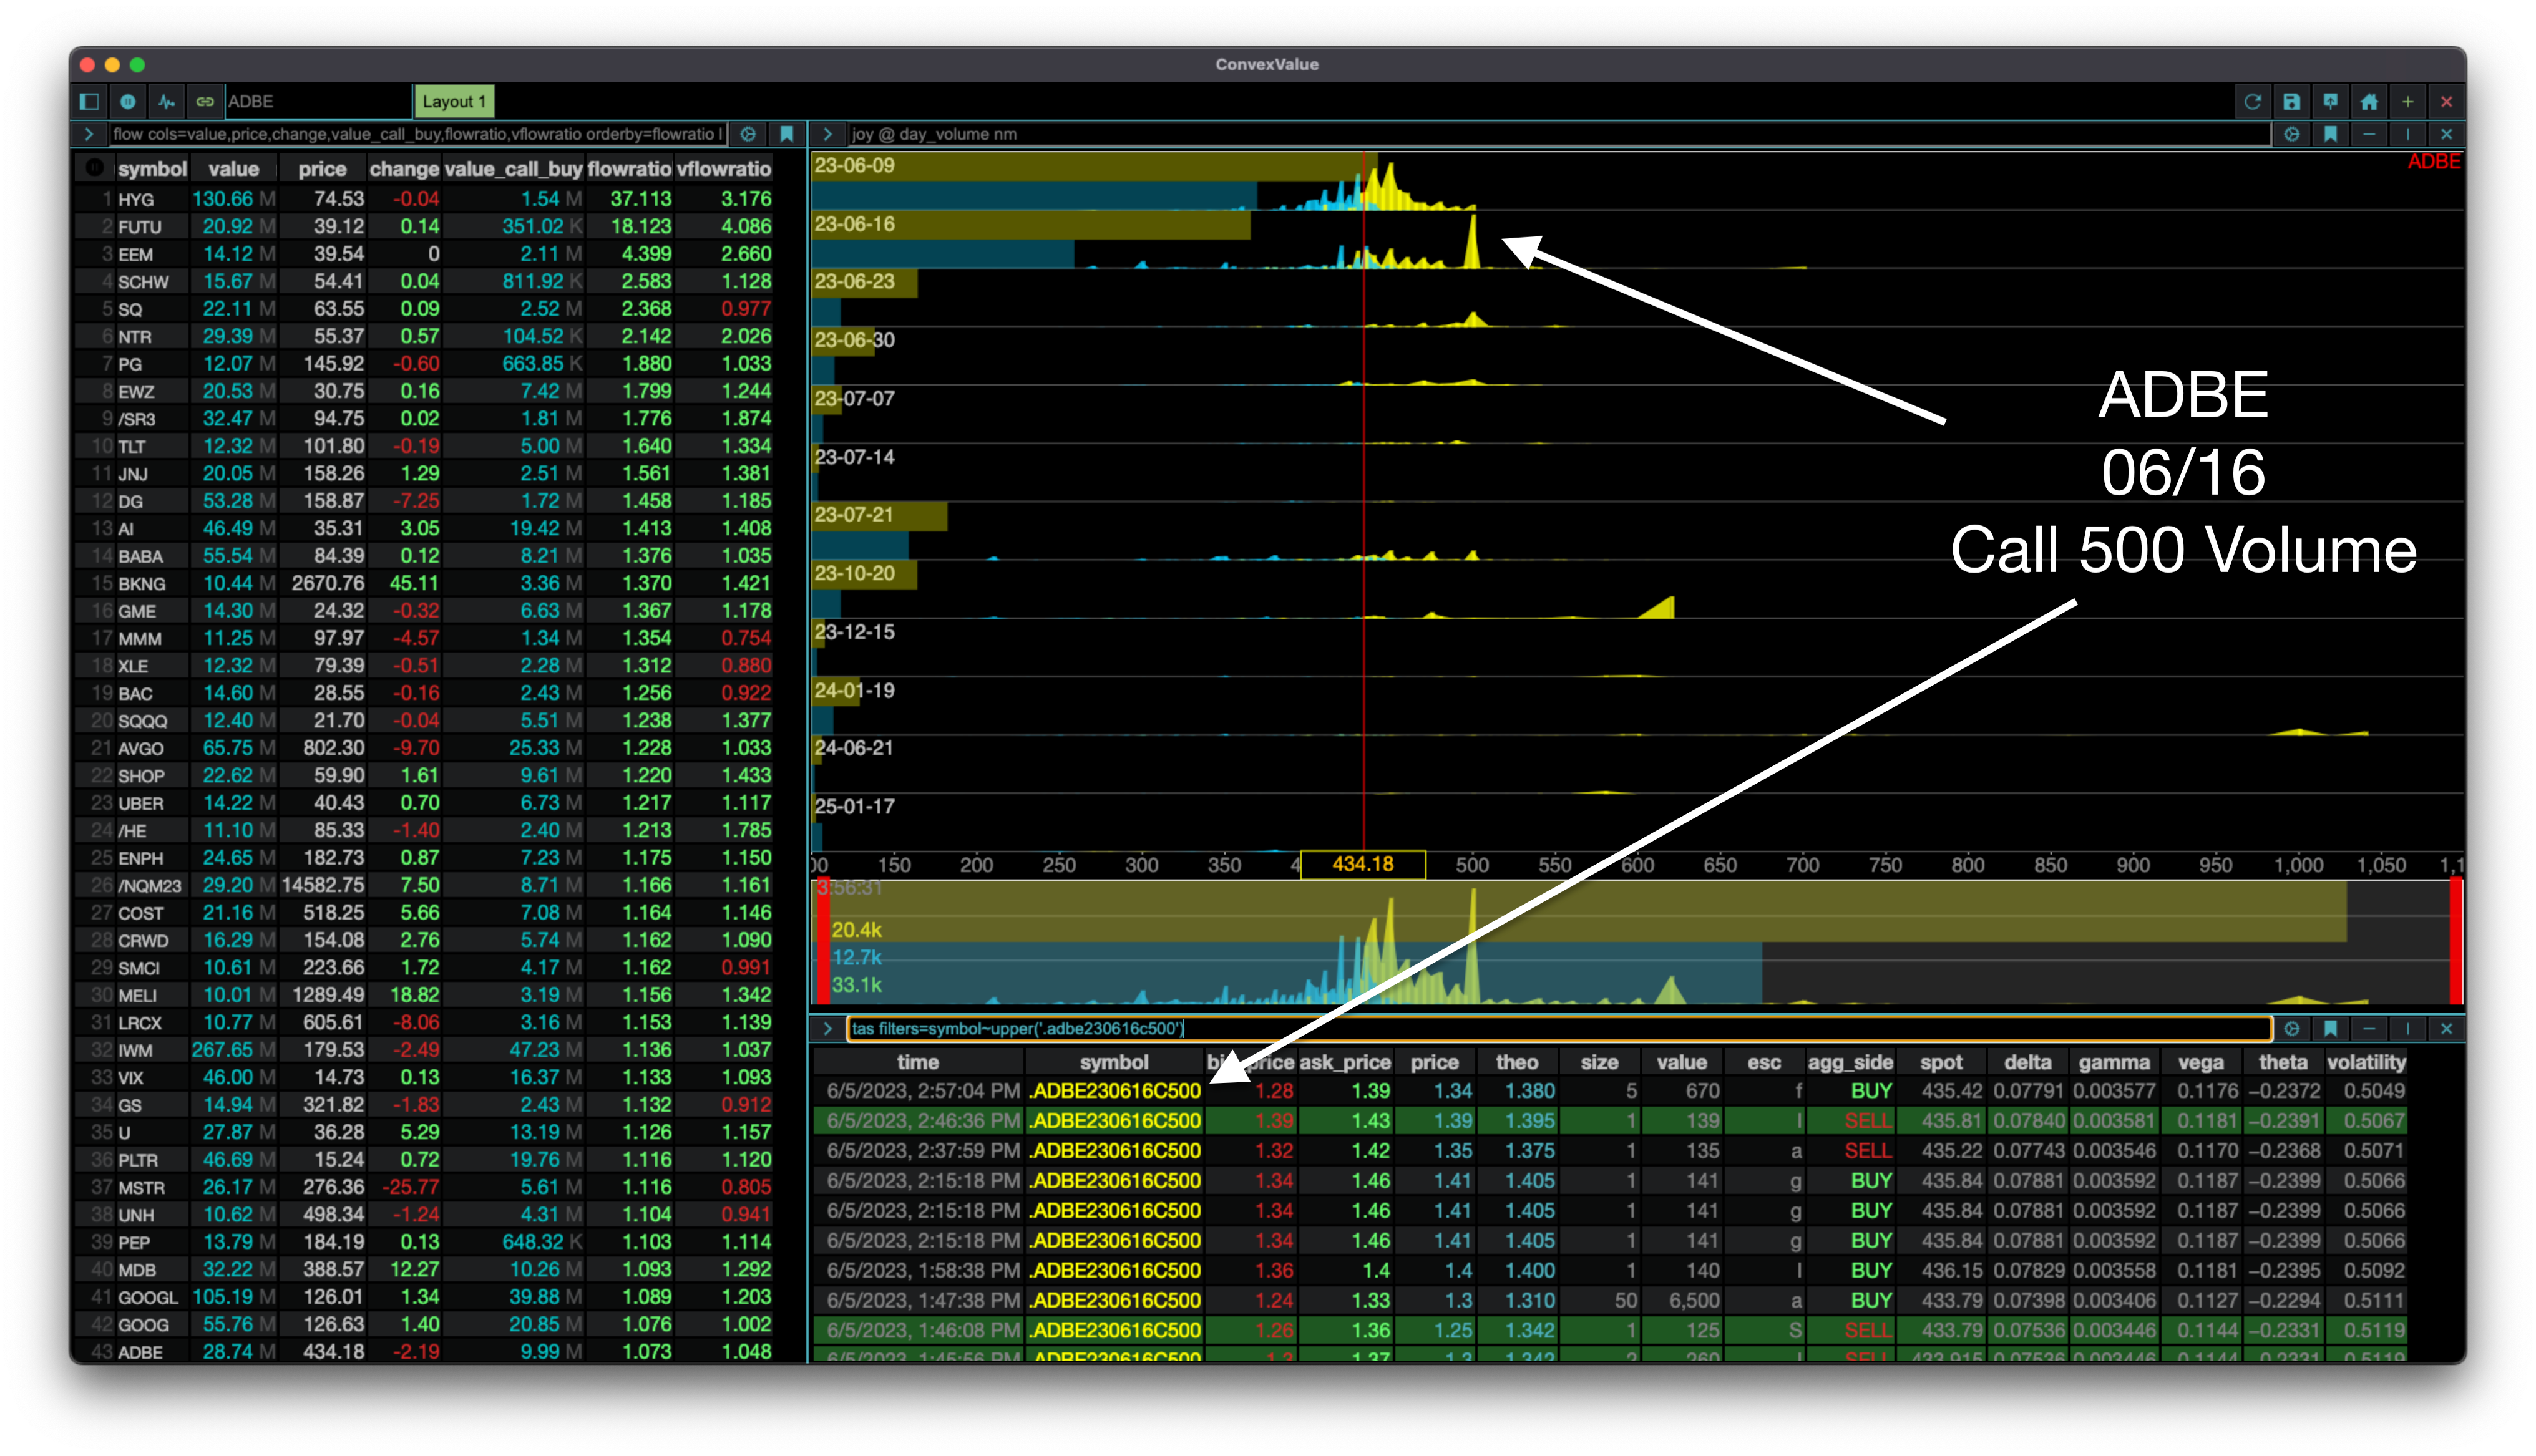
In the first layout I look at the volume surface and identify where exactly the volume is occurring to have full context. Below it I look at the Time and Sales log to see what sort of trades are going through.
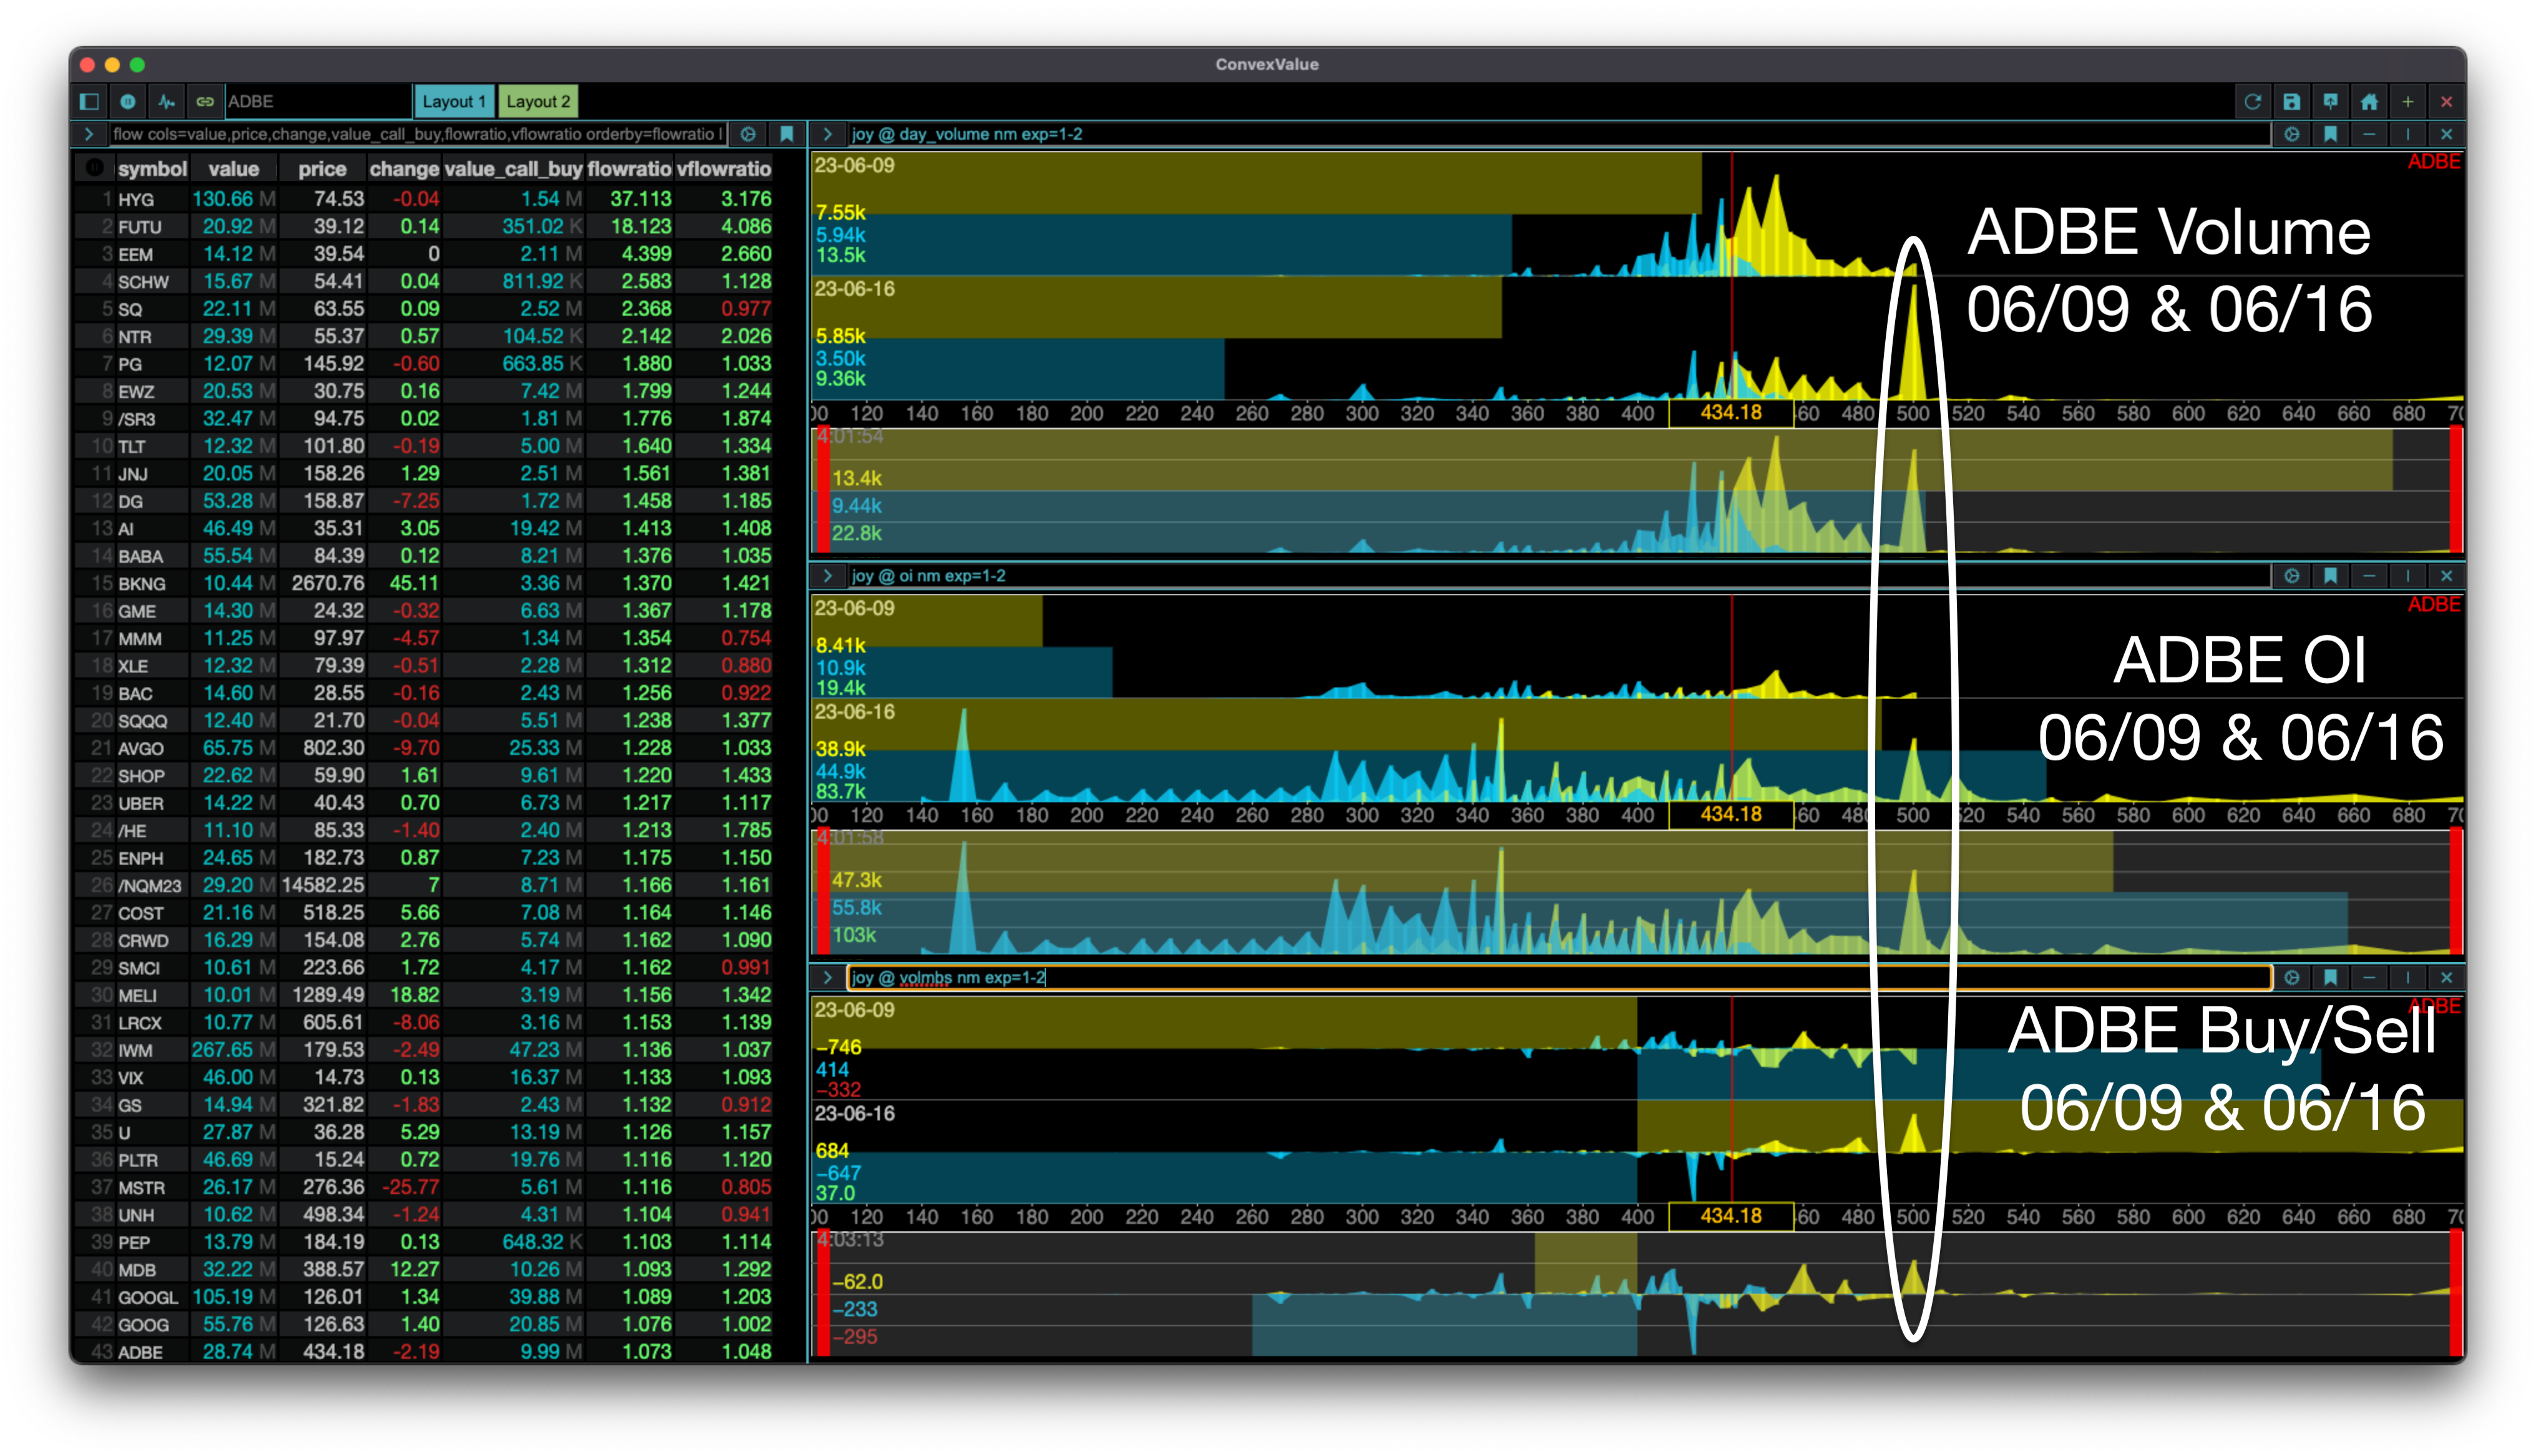
In the second layout I look only at the expirations I am interested in but at different parameters. Most importantly I want to see volume, volume of buys/sells, and open interest.
This lets me see whether today’s action is directional and how it compares to the general positioning for the stock.
As we can see from both layouts - the ADBE 06/16 Call Strike 500 has the highest volume.
In the second layout we can see that most of that volume is in buys. We can also see that open interest is high at that strike - meaning it has been accumulating in the past - although it is worth noting that there is significant open interest in puts on that expiration. In regards to these puts - we don’t see that deep in-the-money put action in today’s volume so it was accumulated in the past.
Now why does it catch my attention? Because usually, volume shapes look like this:
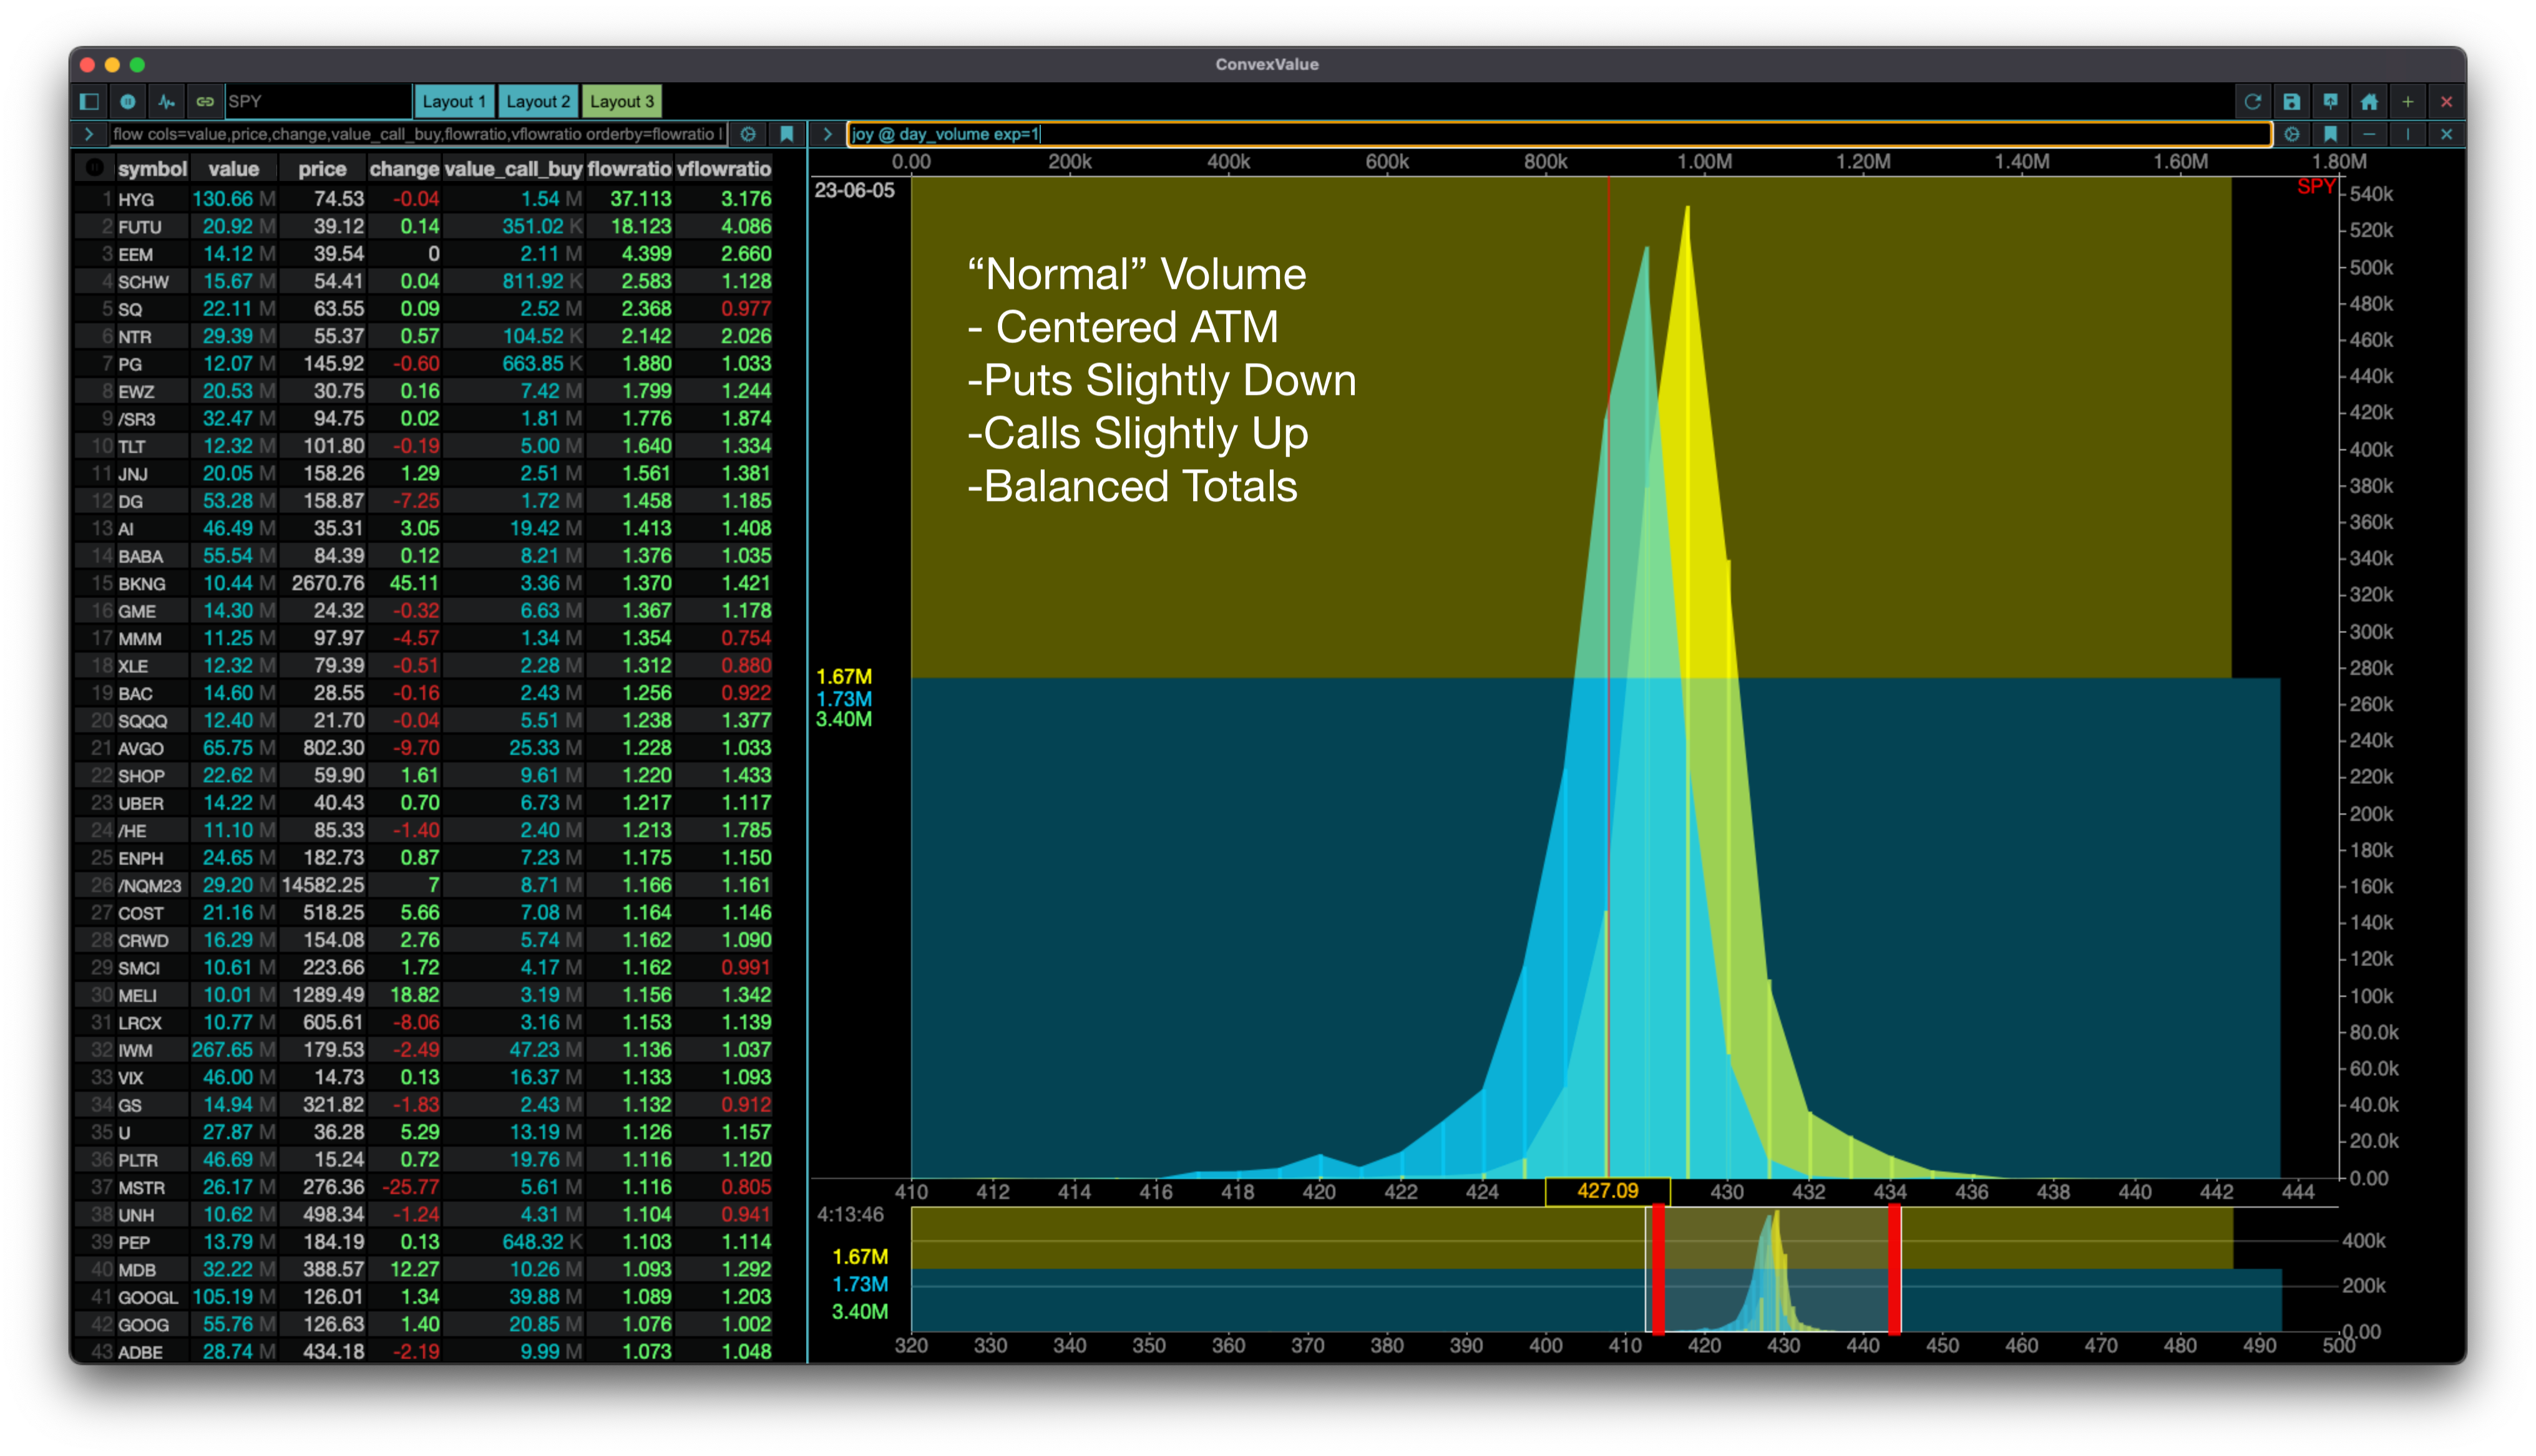
The above is the first expiration for SPY. It looks like a uniform distribution centered near the money and with a balance of calls and puts.
This is how an unusual volume shape looks like:
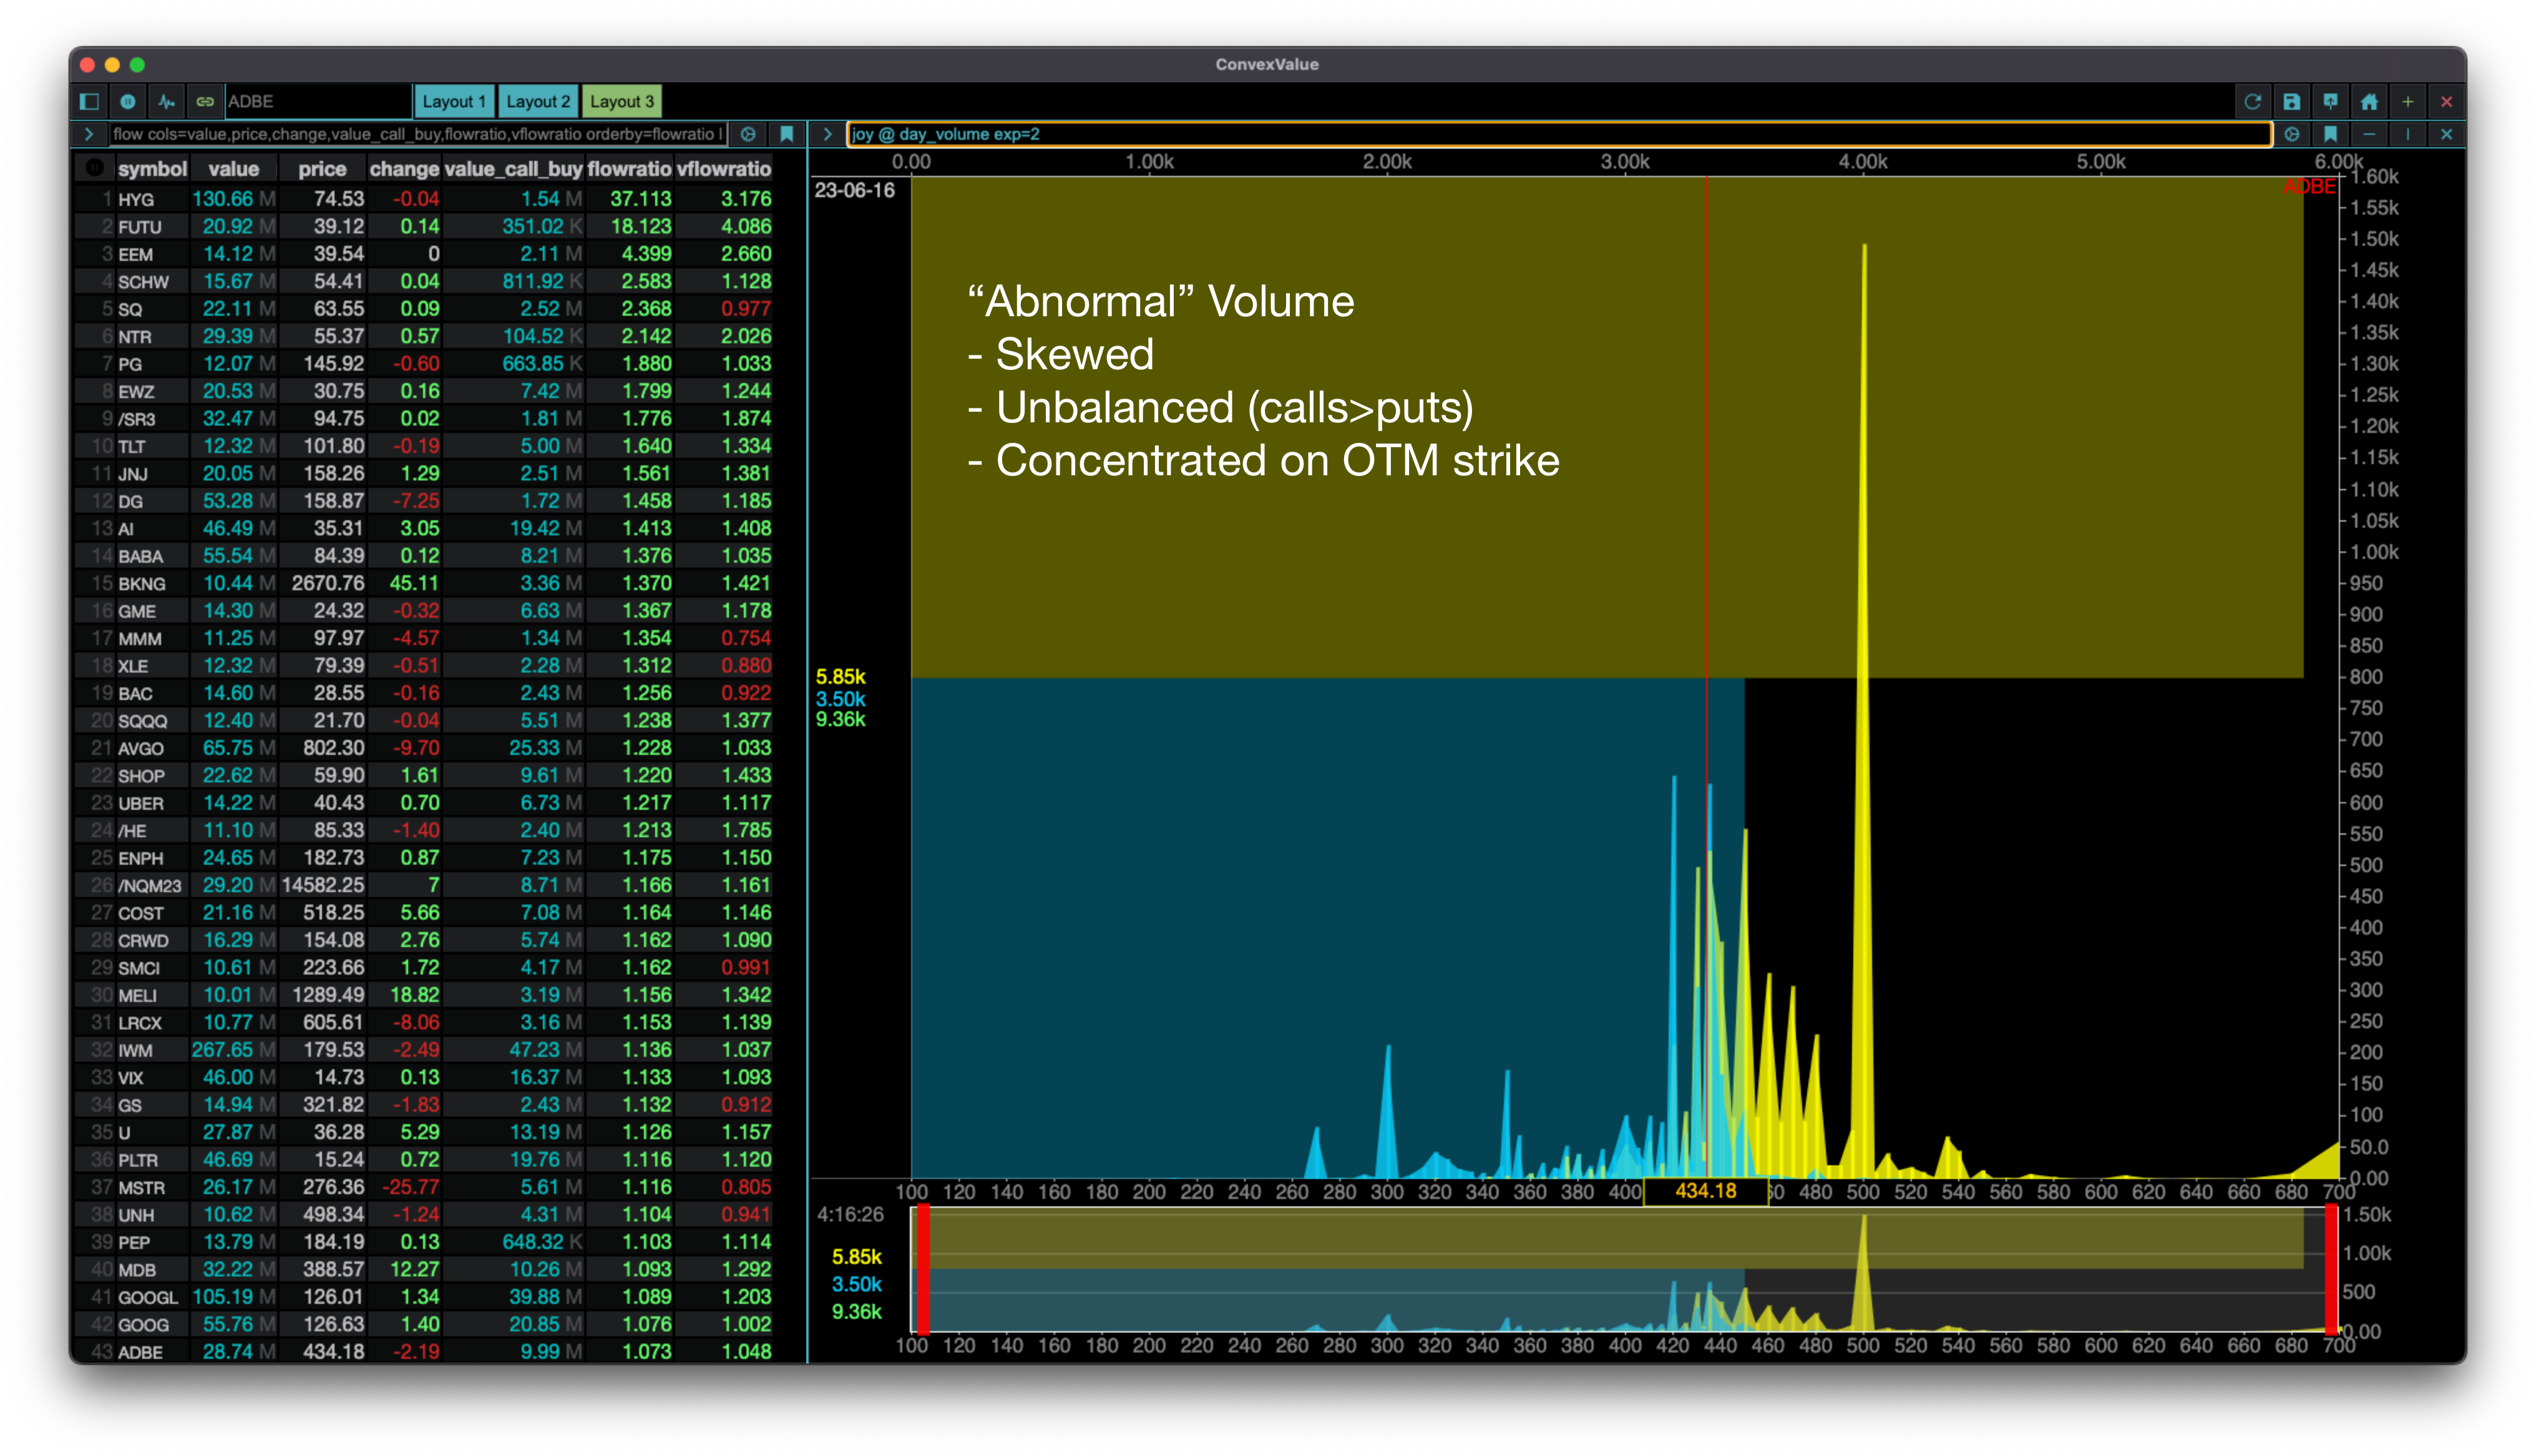
That shape is volume for ADBE on 06/16 expiration. It is skewed, unbalanced (calls > puts), and concentrated on an out-of-the-money strike.
This combination of all the above information, which in summary is:
ADBE high in ranking by flowratio
Volume concentrated on near-term OTM Calls
Volume is mostly buys
Positioning shows accumulation to upside, without accumulation to downside
Tells me I should keep an eye out for those ADBE 06/16 Calls Strike 500 currently trading at $1.3.
Thank you for reading!
Pre-Release Reminder: Everything you see here is available for $49/mo until June 30 at ConvexValue.com . After June 30, price goes up to $249/mo.
As always, at your service.
Cheers,
Juan Bernardo Tobar
As an user of convexmux, i recommend this for anyone interested in options charts.