

Tips #1: vFlowRatio, Volume, OI and Lotto Plays
Tips #1: vFlowRatio, Volume, OI and Lotto Plays
A simple go-to layout to uncover gems. Part of my daily routine.

This 3-split layout is always part of my routine to uncover interesting gems for lotto plays.

The theory is to rank for stock with highest volume of "bull flow" and then inspecting the cause of that flow (i.e where is that volume) and how it fits in with the larger picture (where is the Open Interest).
Breakdown:
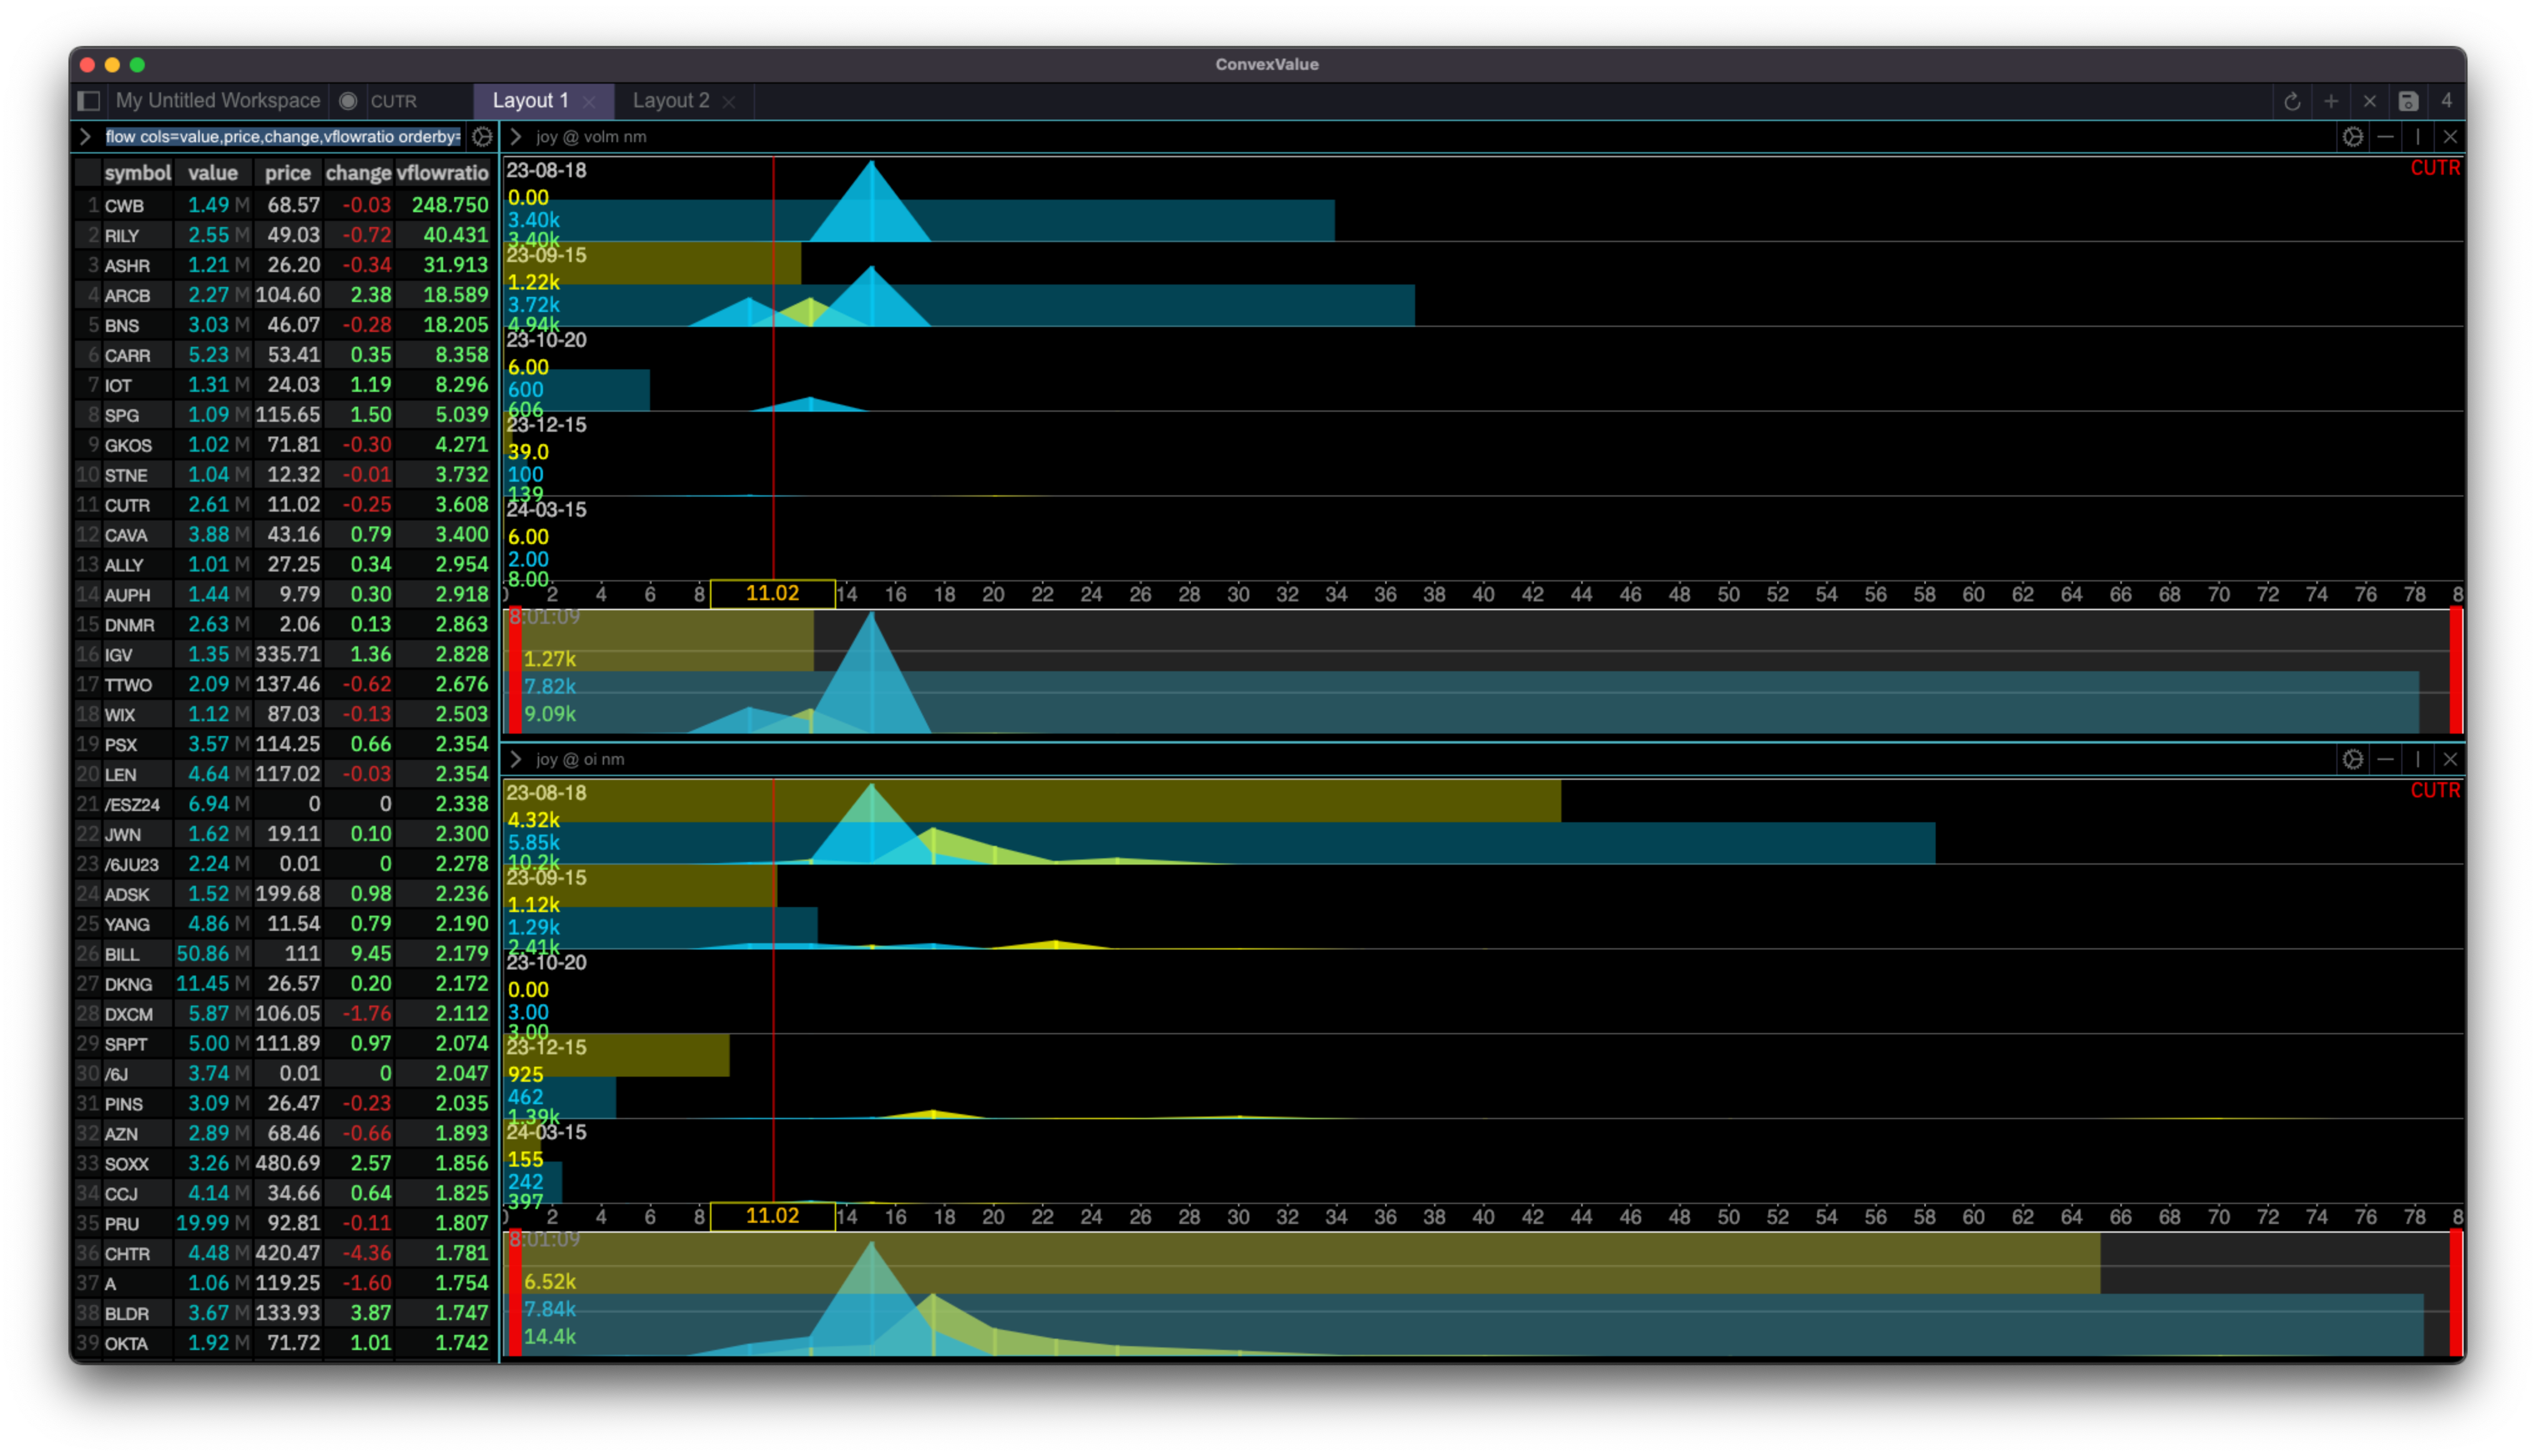
Flow Table
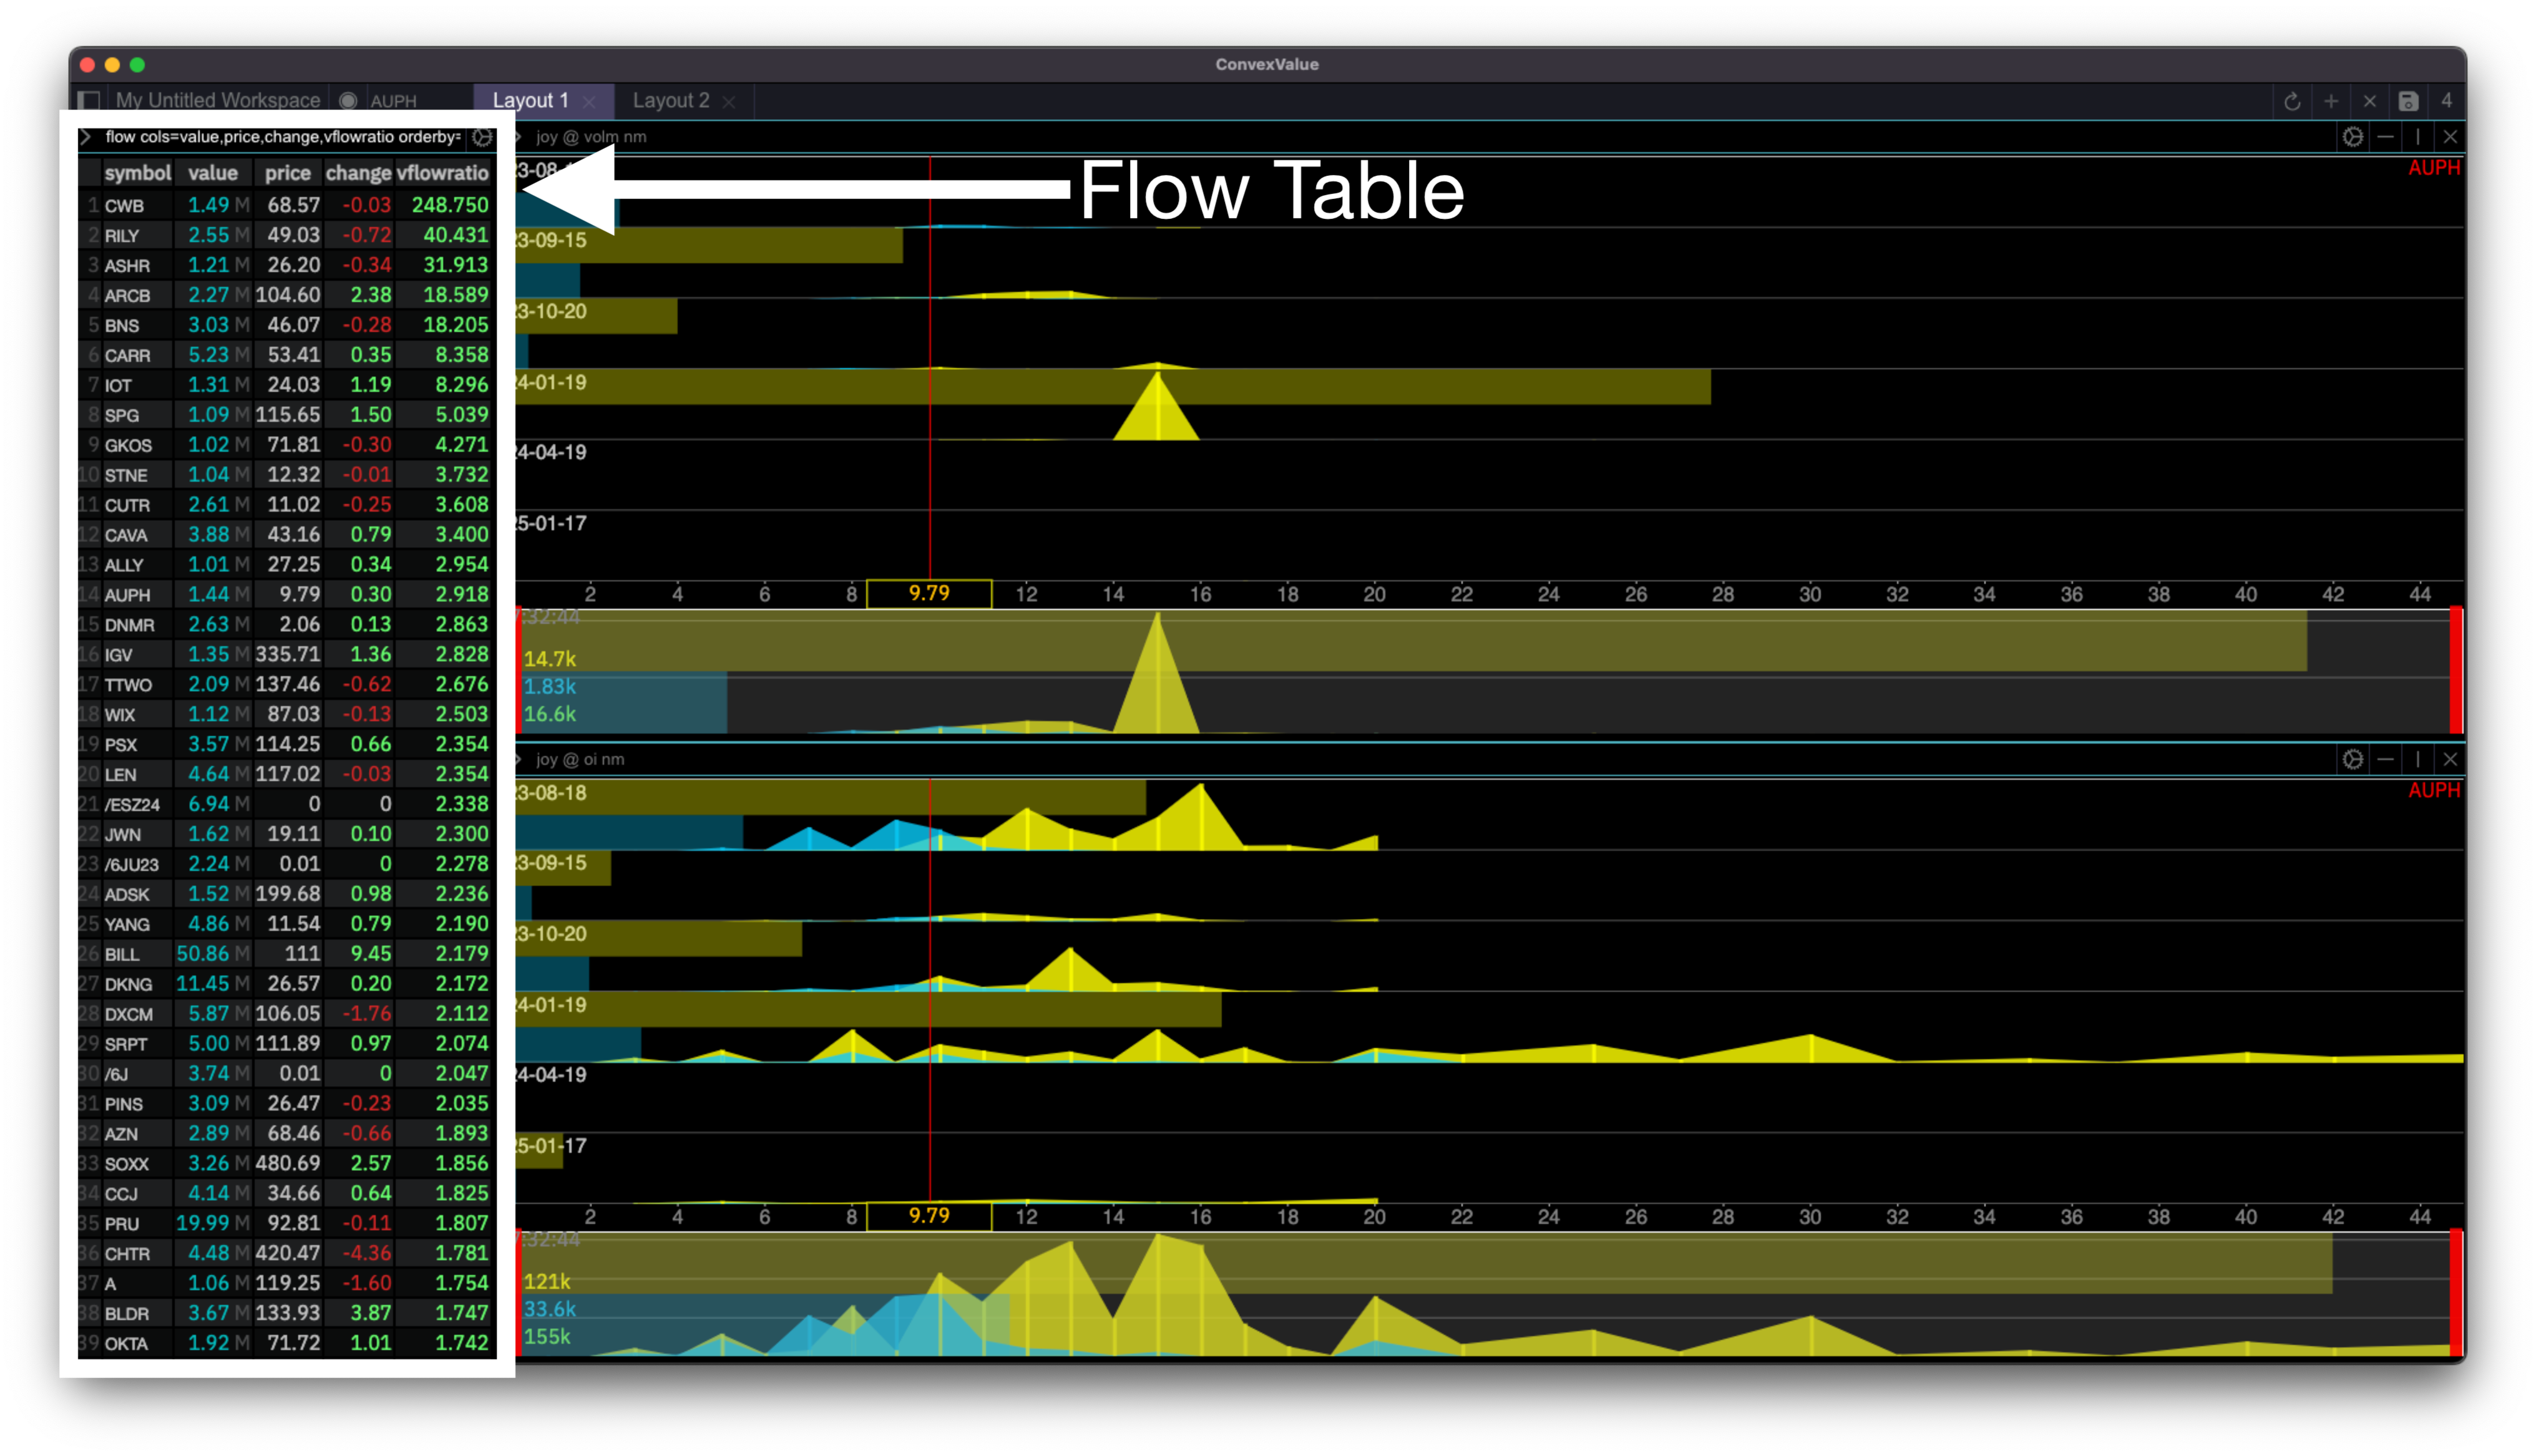
Left split is the flow table. It displays the default:
value: sum of premium spent on all option trades
price: stock price
change: stock price change
However, it has 3 configurations:
added the vFlowRatio column
ordered by vFlowRatio
filtered for value>$1M
First, what is vFlowRatio ? It is a ConvexValue ™️ original. It is the ratio of "bullish flow" divided by "bearish flow".
What is "bullish flow"? Call buying and put selling.
What is "bearish flow"? Call selling and put buying.
Why filter by value>$1M? Liquidity mostly. For example if there is a single option trade where someone bought 200 calls on a micro-cap for $20k, the vFlowRatio is going to be very high, but liquidity might be very low.
Ok, so now we have a list of stocks ranked by vFlowRatio and filtered for value>$1M. Now what?
Now we need to see what is causing that vFlowRatio. Is it calls, is it puts, and in what strikes and expirations?
JOY volume surface
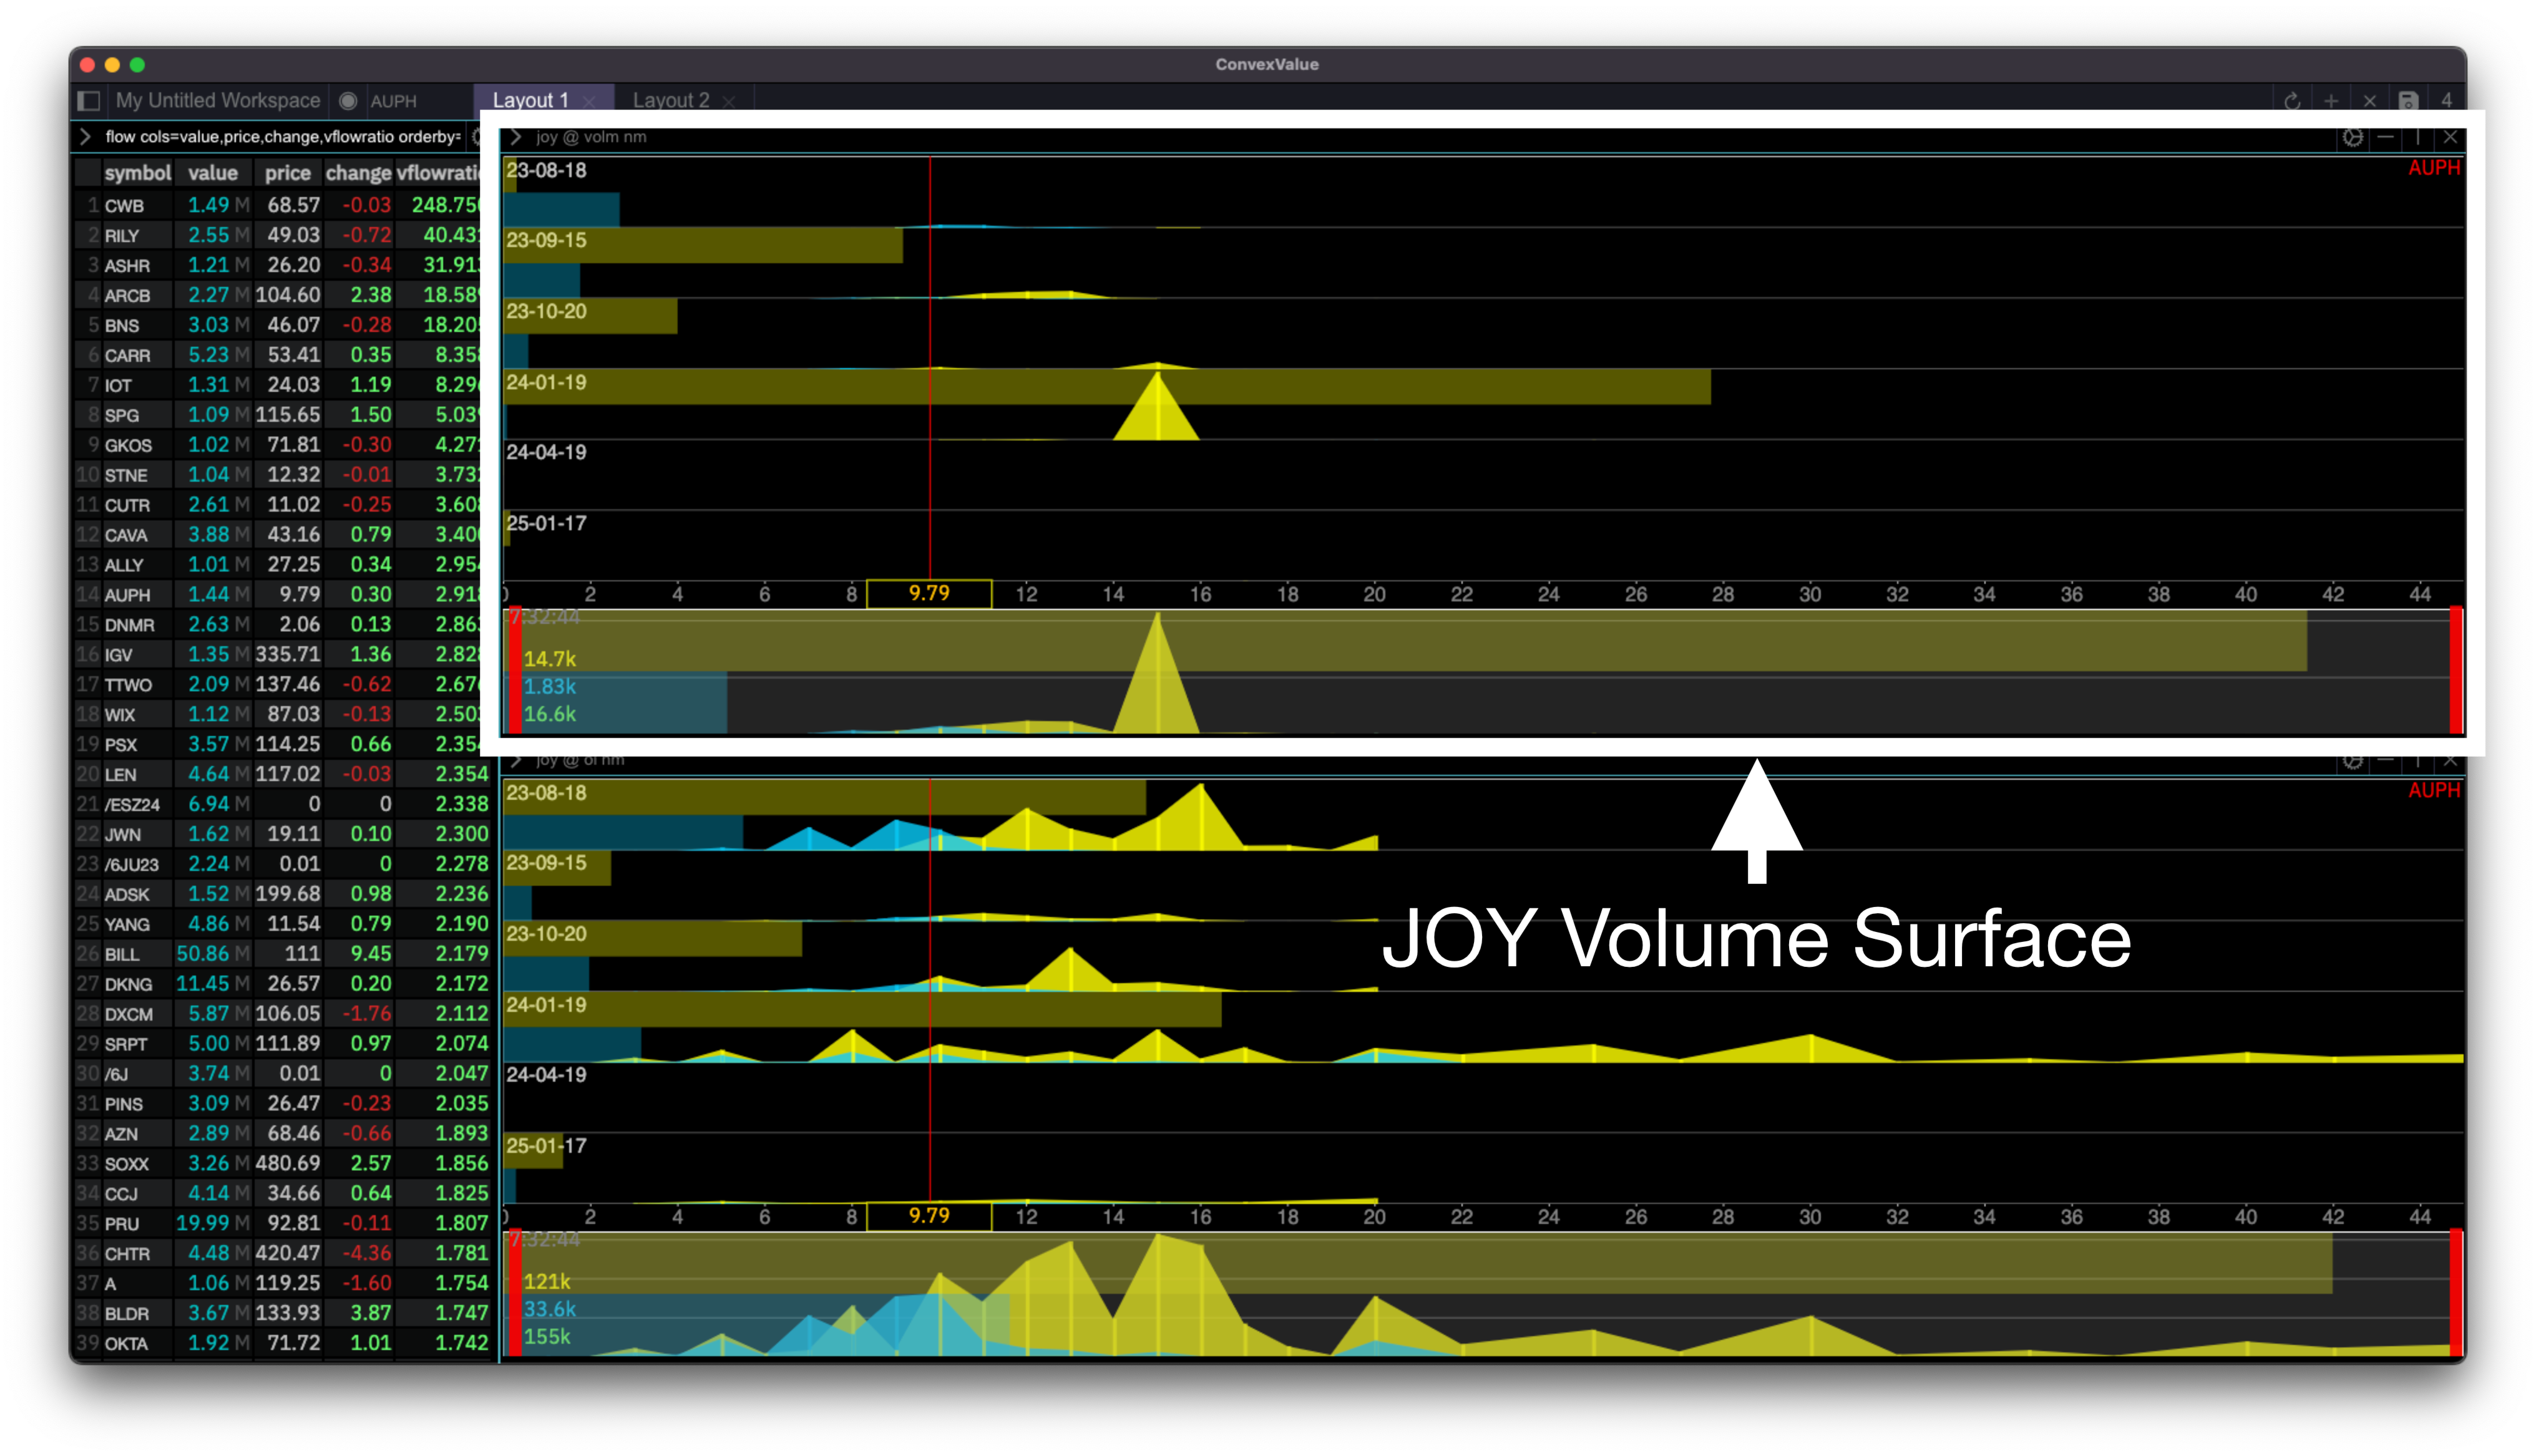
For that we use the JOY module to display volume. It gives us expirations from top to bottom, strikes from left to right, the “spikes” are the value for the contract at that specific strike and expiration, and the horizontal bars are sums. Calls are yellow. Puts are blue.
In the above example we see a lot of yellow (calls), and we clearly see the 24-01-19 Call Volume on Strike 15 standing out. Potentially bullish.
However, today’s volume is just one part of the picture. We need the bigger picture - Open Interest.
JOY Open Interest Surface
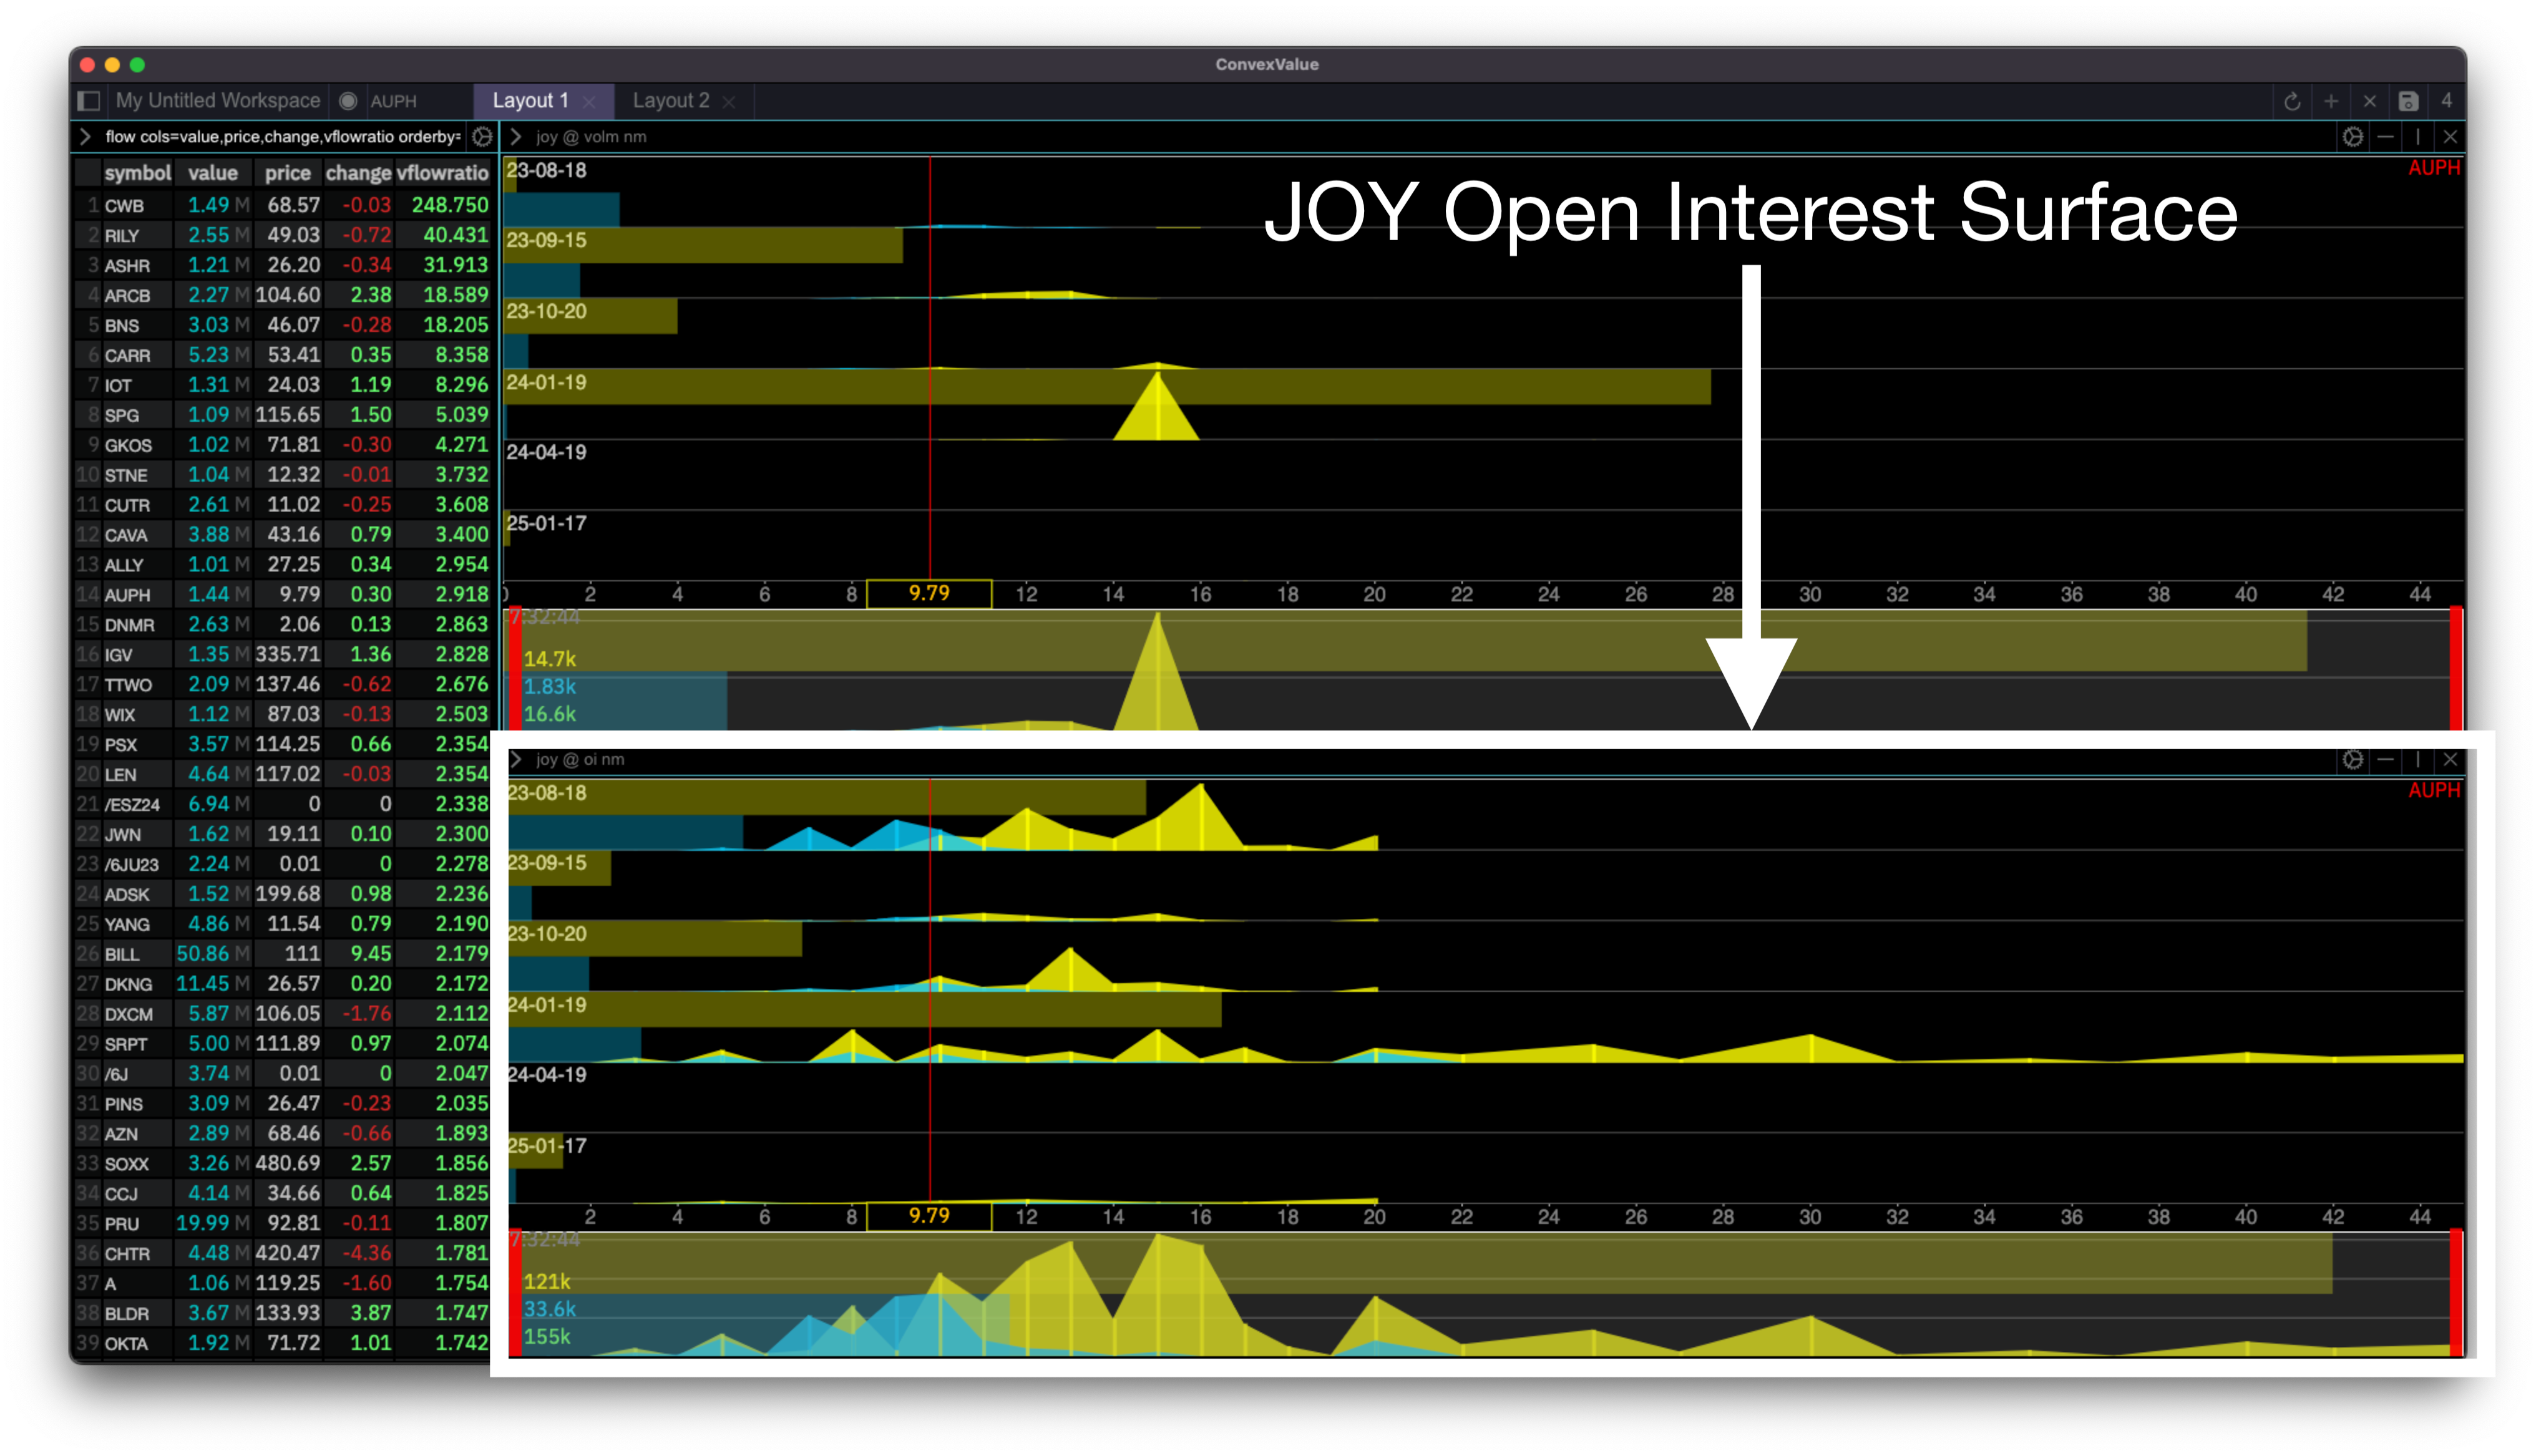
Seeing Open Interest helps out understand where today’s action fits within the general exposure. In the above example we see also a lot of yellow, a lot of out-of-the-money yellow, and very little blue (puts). Potentially bullish.
With a landscape like this I occasionally go ahead and buy some lotto calls and forget about them.
It is a routine scan that I perform daily.
Mechanics
The commands in this layout are:
flow cols=value,price,change,vflowratio orderby=vflowratio limit=50 asc=f futs=f filters=value>1000000
joy @ volm nm
joy @ oi nm
The “@” allows you to click on any symbol on the left table and the JOY surfaces will be shown for that symbol.
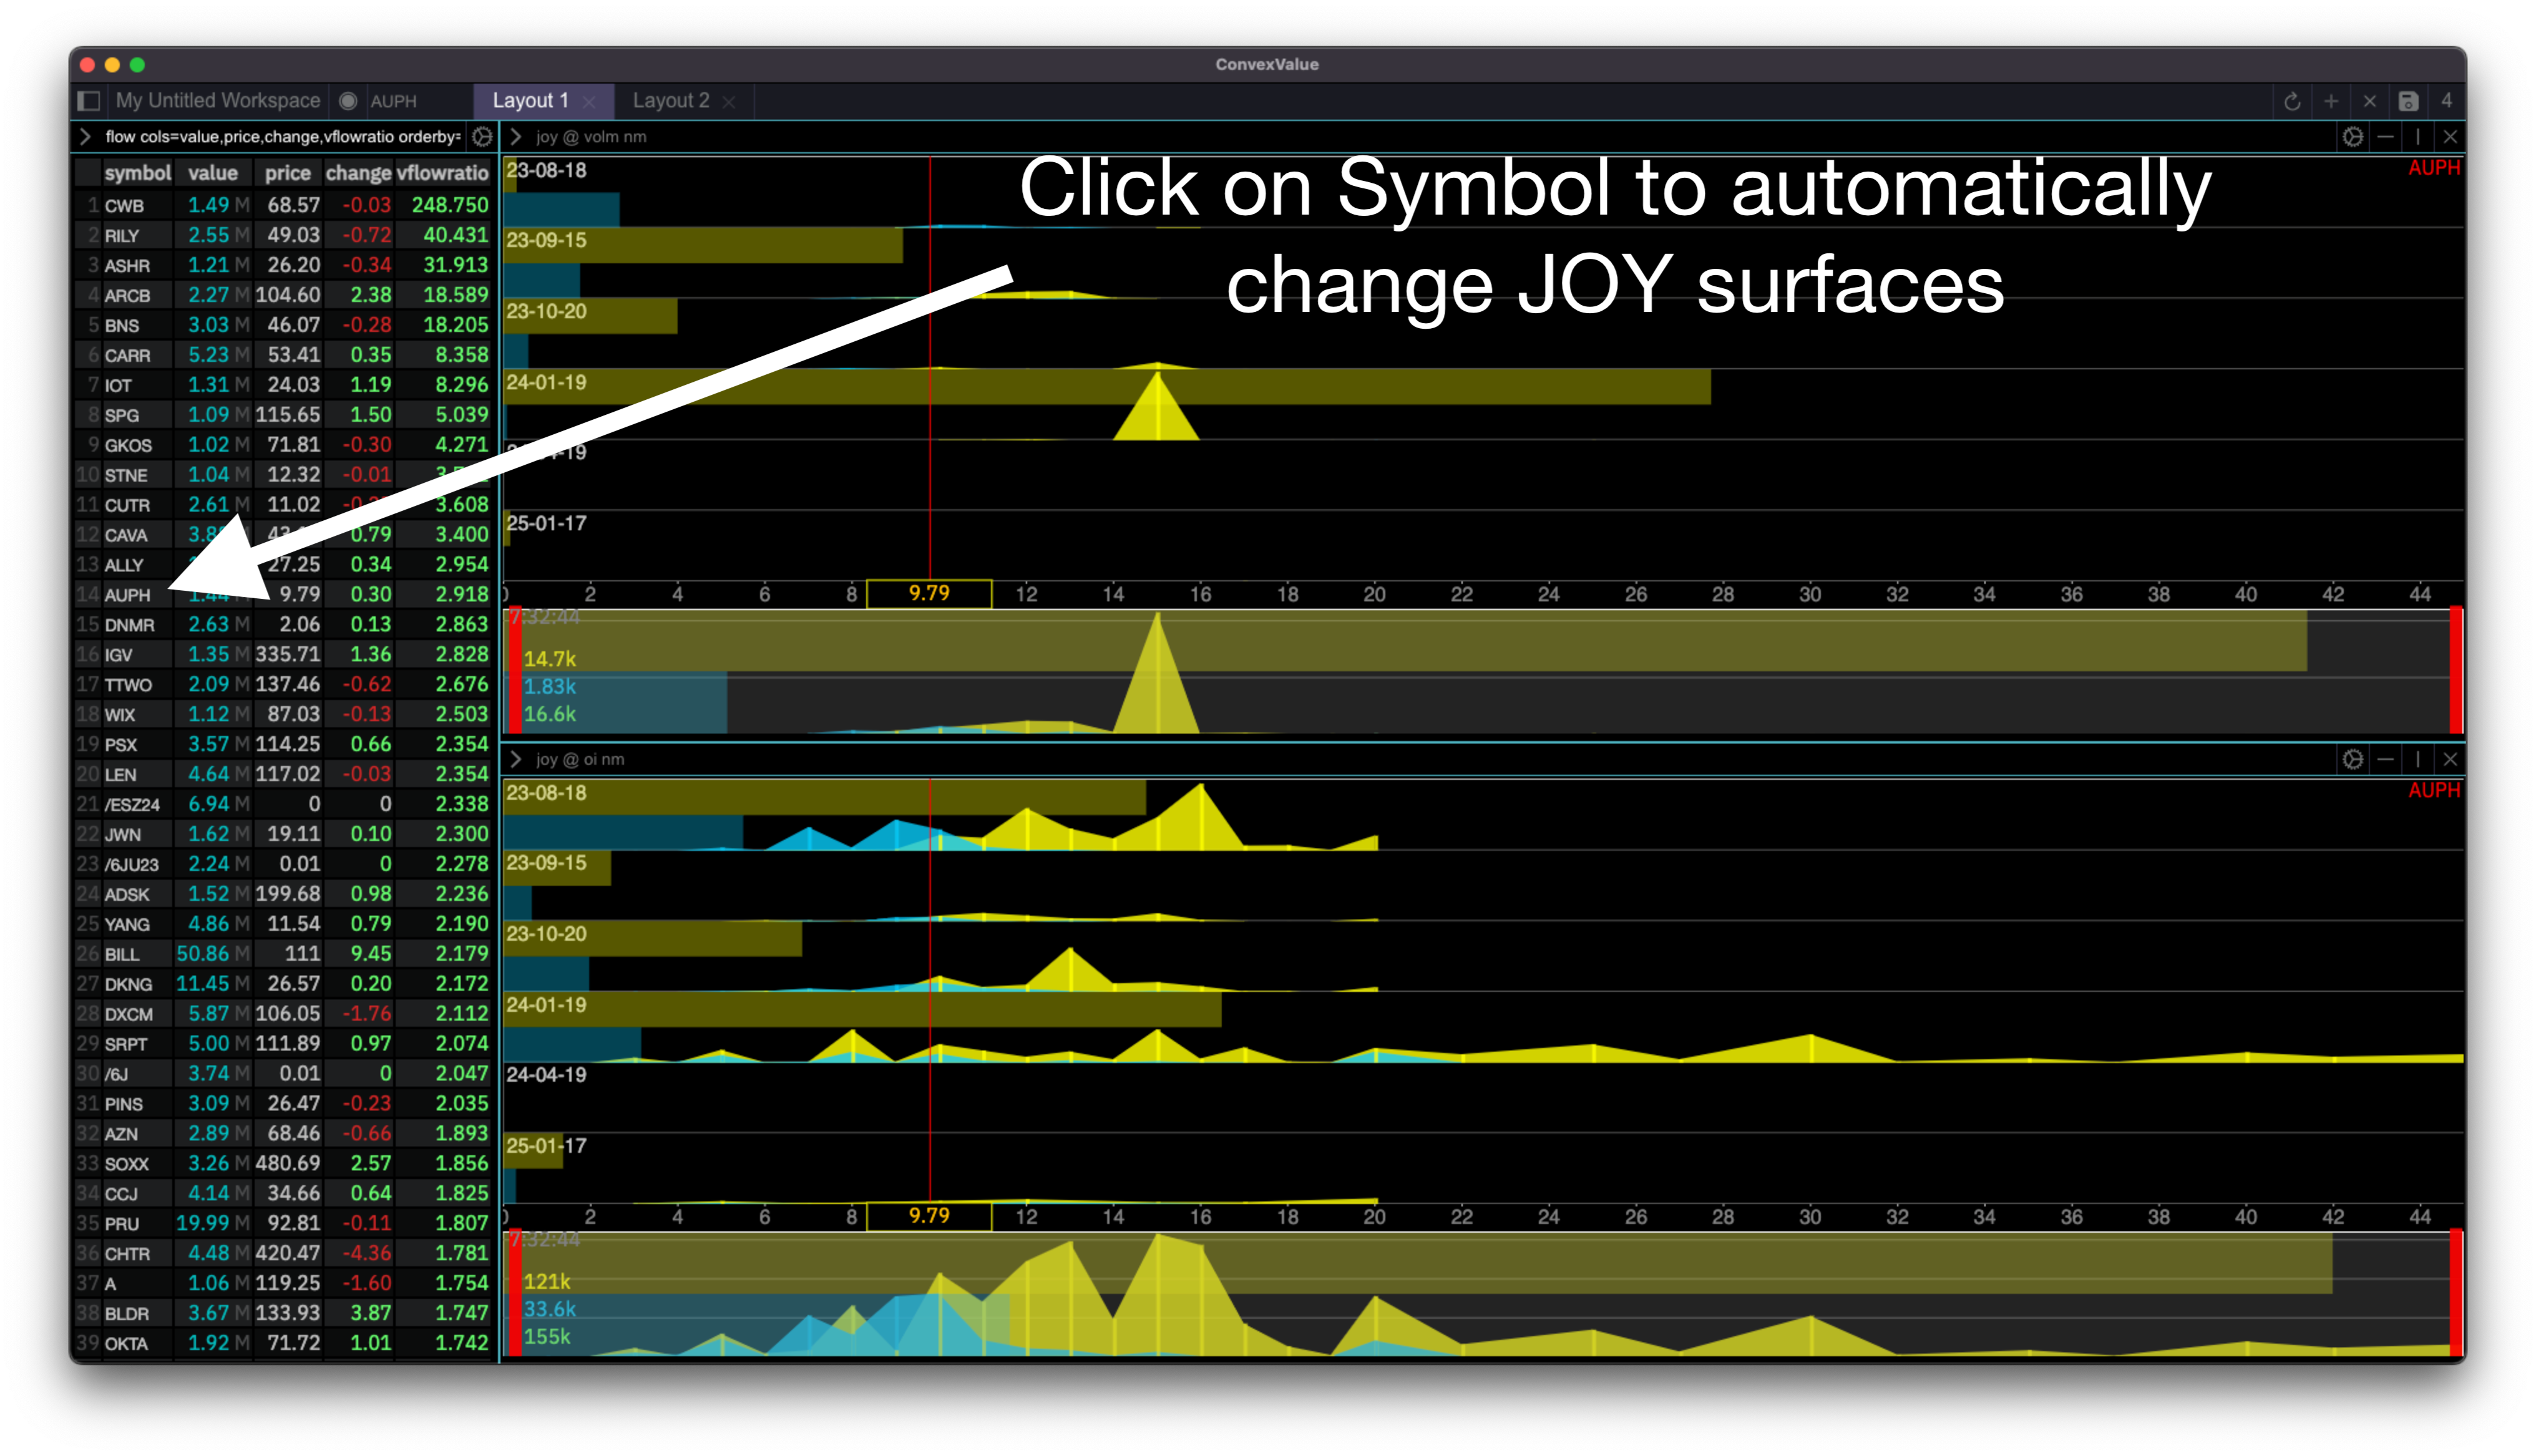
For example if we click on the symbol CUTR we see a very different picture - very put heavy:
Reminder: you don’t need to use the commands to configure the module. You can do it by clicking on the “cog” icon on the top right which opens the control panel for the module.
Any questions, issues, ideas, feedback - I am at your service!
Twitter: @ConvexValue
jb@ConvexValue.com