
What's on the Menu ?
An overview of Modules ready to serve at the ConvexValue kitchen.

Modules are the goods - the delicious dishes.
The ConvexValue Terminal and the web-app are simply the silverware where the dishes are served. So let’s take a brief tour of the currently available modules.
While you do - a useful state of mind is “ok, if that was built, I wonder what else could be built….!”. And if any of this tickles your fancy - consider joining us in building The Terminal for 21st Century Finance.
If you are wondering how to arrive at this:

It is just combinations of the following modules.
Let’s get to it:
flow
The flow module is a live table of underlyings and parameters. The parameters include basic ones such as price and change, as well as parameters derived from options data such as deltas, value_buy_call, etc. and some proprietary metrics such as flowratio. You can select which columns you want to display, how to order the table, and filters. As you can see you can choose to display as many or as few columns as you'd like, and you can customize the module via commands or via a control panel:

On the top left you see the flow module only showing a couple of columns. Beside it you see it displaying many columns. Depending on your computing power you might be able to show all 5000+ symbols and hundreds of columns - all of this data is live!
All modules are accessible and customizable via command, but in addition they all have a control panel that lets you customize the module using a point-and-click interface. You access this control panel by clicking on the “cog” icon to the right of the command bar. It can be a great tool to help you learn the ropes!
flowsum
The flowsum module tells you the aggregates of puts and calls for each expiration for a given underlying - parameters includes value, value_bs, deltas, gammas, etc. There is little customization for this module apart from selecting the underlying and certain formatting parameters - a great starter module!

joy
The joy module is one of the favorite ConvexValue originals. You tell it what underlying and what parameter you want to visualize and it gives you a breakdown by calls, puts, expirations and strikes. It is vastly customizable. In the pictures below we are looking at AAPL, and from clockwise we are looking at:
Open Interest for all expirations, yellow is calls, blue is puts
Aggregate value traded grouped by strike and expiration
net aggregate gamma multiplied by open interest - above the line means positive gamma, below means negative
gamma for the first 5 expirations
This is one of the most powerful modules that lets you see data as granular or big-picture as you like.

oich
This is one of the simpler modules - another starter module! - oich stands for open interest changes. It gives you a table of open interest changes. You can apply many filters and select an ordering. Below is simply a ranking of all option contracts ordered by percent change in open interest.
I usually use this module before market open. I browse through the contracts and combine it with the joy module above to see whether those contracts fit within a clear bullish or bearish narrative.
It is great to find biotech plays!

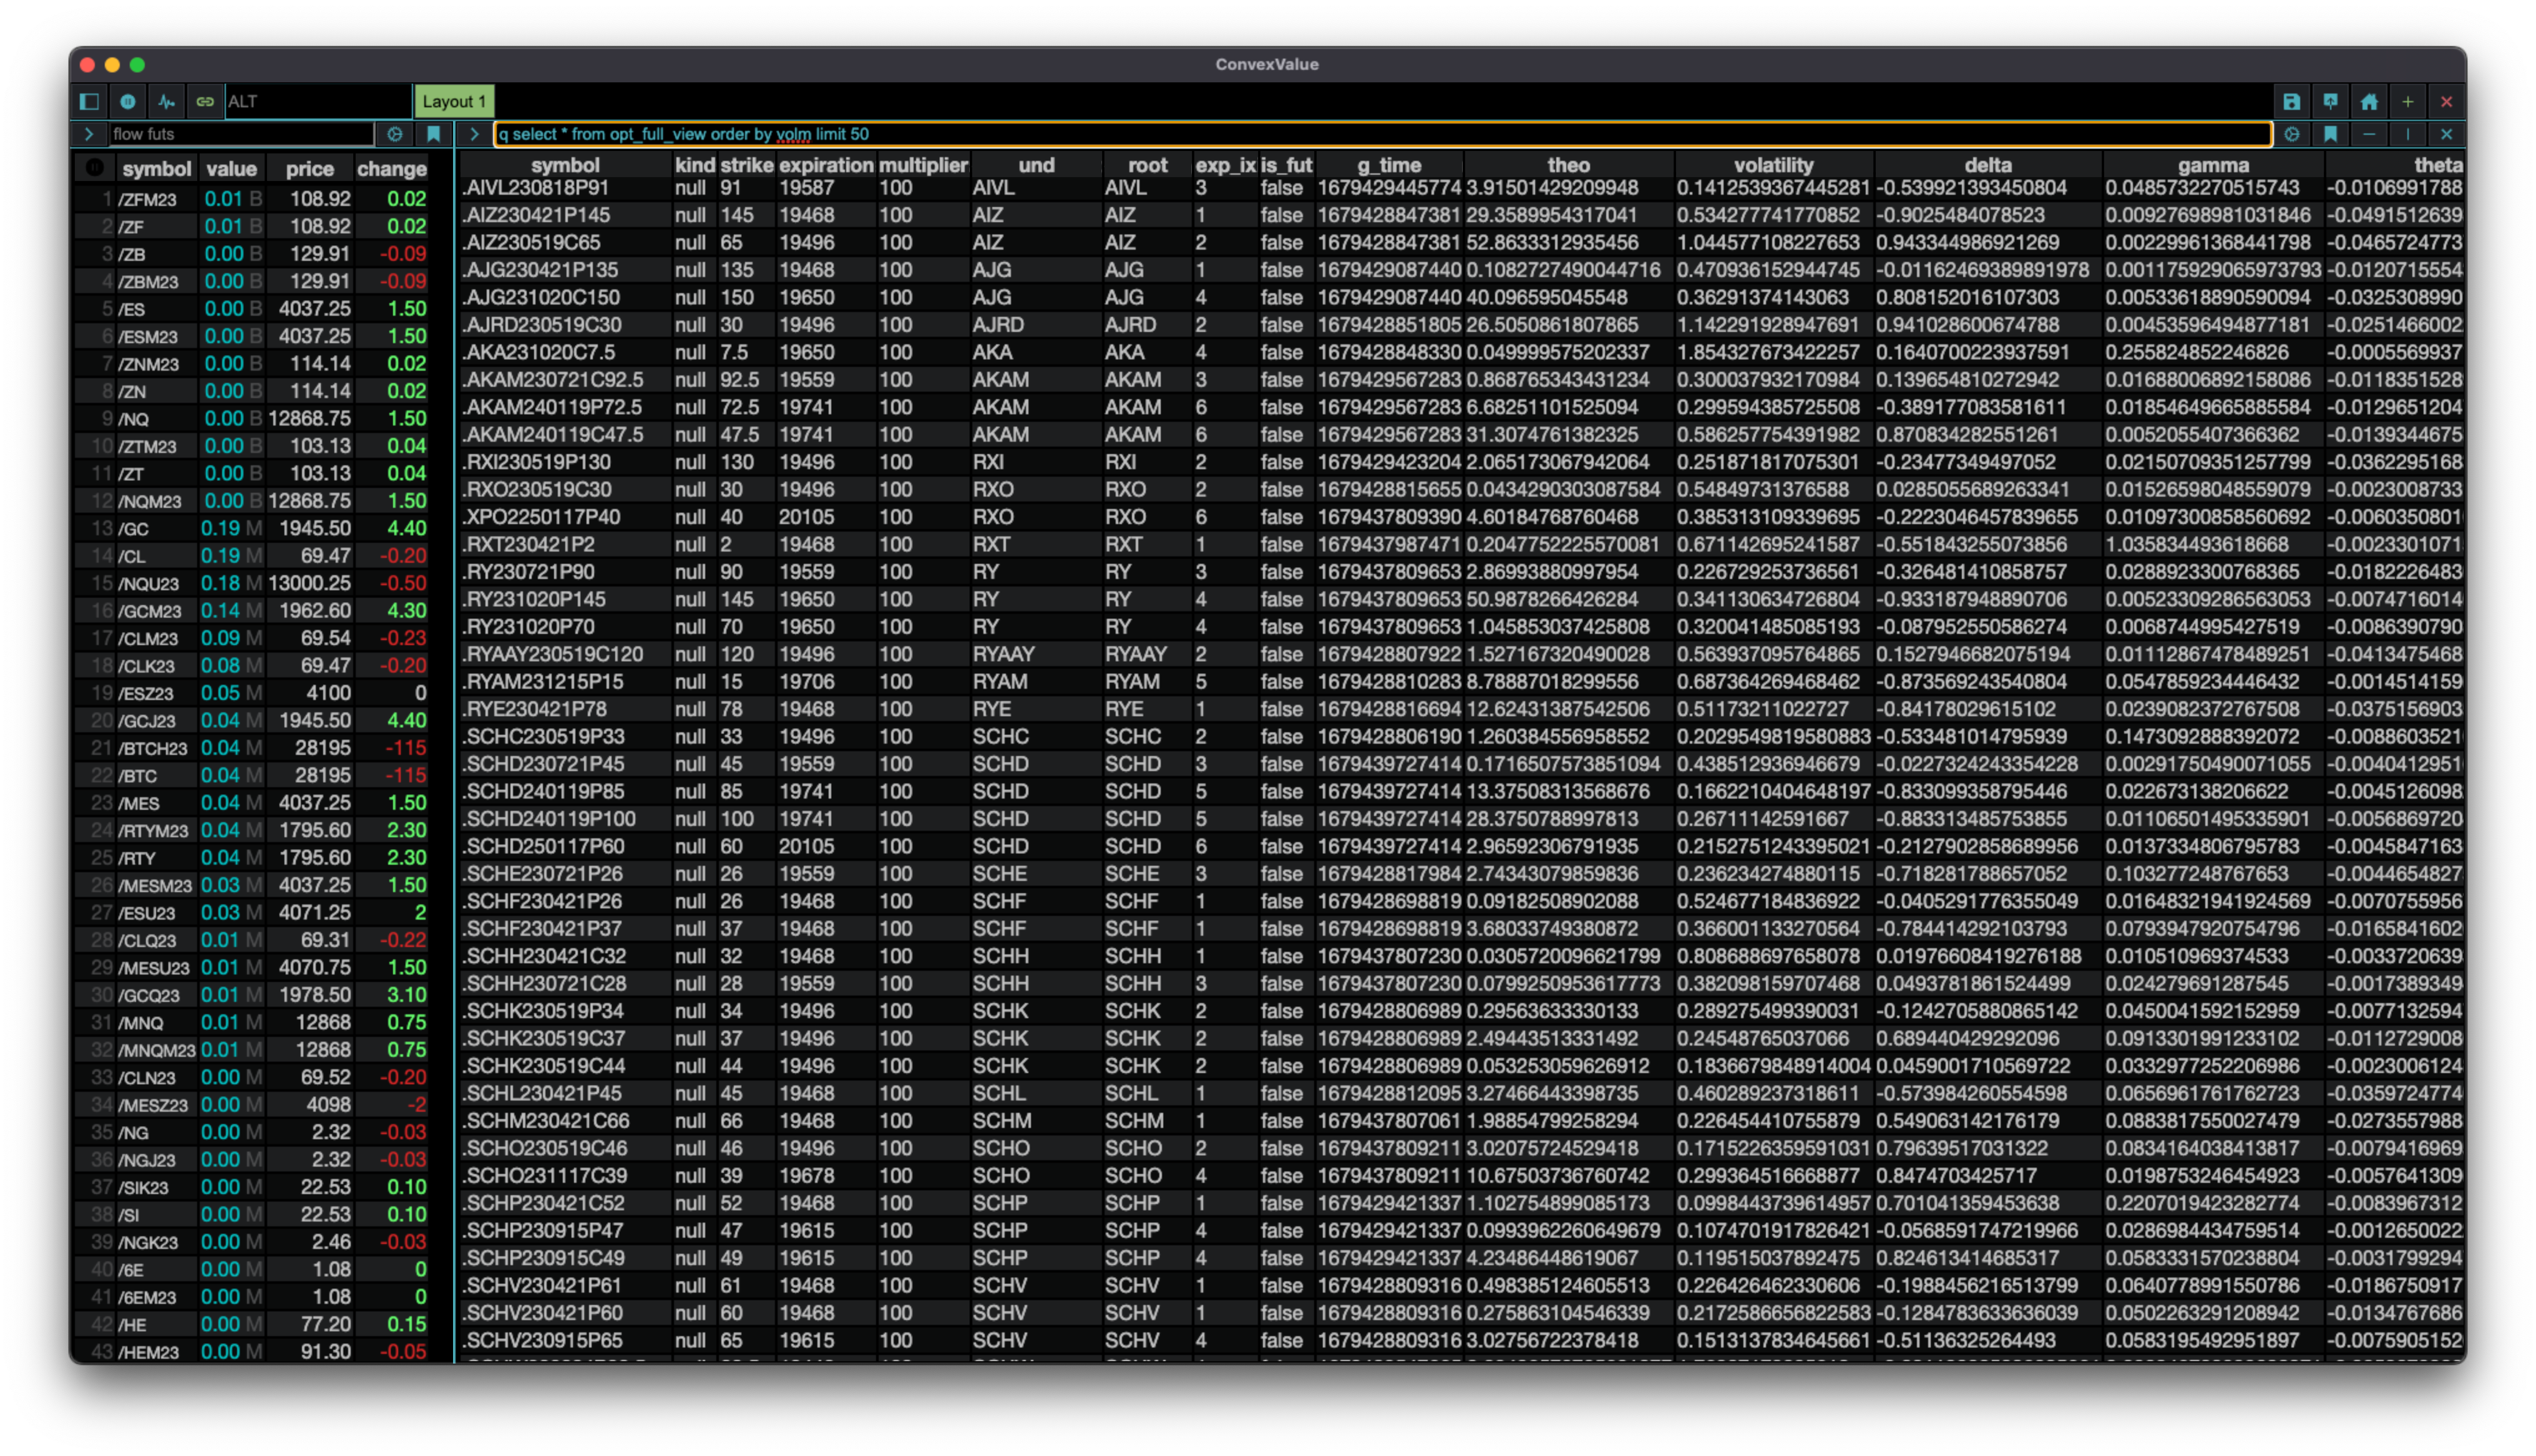
opt
The opt module is similar to the flow module in that it is a live table where you can select the columns to view, the ordering, and filters. However - unlike the flow module where each row is an underlying, here each row is an option contract.
This is similar to the “chain” views you find in brokerage platforms in that you are looking at actual option contracts and their live prices. If differs in that you don’t have the “chain” view of separating calls/puts/strikes nor are you restricted to a single underlying. You query the ConvexValue database to give you the contracts you want and then it begins to feed live data.

q
The q module is as raw as you can get! q stands for query. And you can input any query you like in SQL. If you don't know SQL this module might not be that useful (although ask me for help!). If you do know SQL this can be very powerful. Soon we will attach ChatGPT to this to allow you to make queries using natural language - stay tuned for that!
stks
It stands for “strikes”. This module aggregates a specific option parameter by strikes, and separates by call, put, and sum of both.
This is also a starter module. Very simple, straightforward, and almost no customization.
You select a symbol - for example AAPL - and a parameter - for example open interest - and it tells you on a strike-by-strike basis what the aggregates are. It is the same data that is used for the `joy` module but in a different display format.
This is an example of the power of the ConvexValue kitchen. We have all of the data to make virtually any view possible! A member asked to see data in this format because the "joy” format wasn’t ideal for them. So I went ahead and built it! (just another benefit of being on the Chef’s table!)

tas
What kind of Options Data Platform would this be without a Time and Sales log! This is it.
Extremely simple to get running. It has a couple parameters that you can add to filter the sort of trades you want to look at. For example if you only want call buys at the ask with delta lower than 0.05 and ordered by volume - you got it!
Apart from the raw time and sales data - it also includes spot price, value, volatility, greeks, and the module uses color-coding to identify buys, sells, trades that cross the spread, etc.
As all modules here - I can make improvements on-the-fly! So if you have recommendations or ideas on how you like to consume this data, do let me know. Maybe they result in improvements to a module or maybe they result in a whole new module!

flowchart
Remember the flow module way up top that gives you data for underlyings along with many option-derived parameters and proprietary metrics? If you scroll all the way up you’ll see it is a table with live data, meaning it gives you just the latest values.
Well…
this one gives you a chart!
You select the symbol and select as many parameters as you wish (deltas,flowratio,value bot and sold, etc) and it gives you a chart with a 10 second interval. There is serious alpha here - we just have to find out where exactly!
I have spotted that specially flowratio and valuebs has strong moves before price has strong moves. I know there is something there. I hope some of you can find it!

olay
The olay module is very similar to the joy module, but instead of plotting each expiration in a different axis - it plots in the same axis.
This is the module you might use to compare volatility curves.
As in joy, it shows puts in blue, calls in yellow, and shows you the values of the nearest option when you hover over it. You can zoom in using the brush on the bottom.
It also has a special "otm” parameter to only display options out-of-the-money like you see below.
For example here we look at the out-of-the-money volatility for SPY for the first 3 expirations:

skew
This module looks at the volatilities for an underlying and calculates a skew. The default calculation is using 25 delta put minus 25 delta call divided by the 50 delta option. However you can customize it to select what deltas you'd like to use. The chart shows the skew along with the volatilities of the options you use in the calculation.
It is accompanied by a table displaying all the values so you can see the interpolation used to extract the estimated volatility when a strike is not exactly in the selected delta (which it usually isn't!).

terms
This module displays the current volatility term structure for an underlying along with the volatility structure in past days. This lets you see how and where volatility has been changing. Colors are used to display the date - with yellow being today, red yesterday, and the rest correspond to days in the past. You can select how many days in the past you'd like to see.
In the below chart we see that AAPL volatility fell across the entire term structure relative to yesterday.
You can zoom in on the chart and hover over it to see the exact values. It also gives you information about amount change and volume for each expiration.

That is all for now! However, it is likely that next time you check in there are more modules and improvements. And part of being on the Chef’s table is that I can do my best to address each of your requests and implement them - this way you can shape what the platform is an make sure it addresses all your need!
Oh wait - there is one last module, the ”home” module. I’ll leave it to you to explore that one!
If you’ve made it this far, chances are you are even a little bit curious! Consider joining me on this journey. I need your support to keep building this. And if the tools you see here aren’t quite what you need but you see potential - let’s talk! - I can make them what you need.
As always, at your service,
Juan Bernardo Tobar
jb@ConvexValue.com
ConvexValue.com
ConvexValue.com/docs
And follow us on Twitter for the latest updates! @ConvexValue